
Key Events This Week
15 Jun: Intraday high of Rs.1,784.95 with a 5.05% surge
15 Jun: Mixed technical signals emerge amid bearish momentum
16 Jun: Technical momentum shifts with mildly bearish trend
19 Jun: Week closes at Rs.1,794.40, up 6.20% for the week
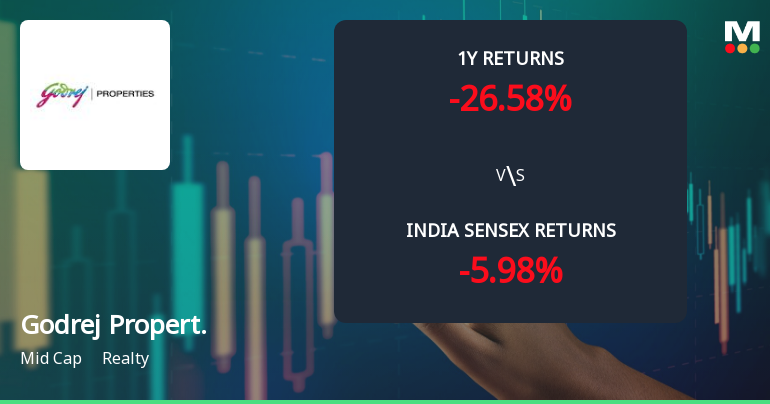
Godrej Properties Ltd Technical Momentum Shifts Amid Mixed Market Signals
2026-06-16 08:03:49Godrej Properties Ltd has exhibited a notable shift in its technical momentum, moving from a bearish stance to a mildly bearish trend, reflecting a complex interplay of technical indicators. Despite a strong day change of 4.52%, the stock remains under pressure with a MarketsMOJO Mojo Score of 29.0 and a Strong Sell grade, underscoring caution for investors amid mixed signals from MACD, RSI, and moving averages.
Read full news article
Godrej Properties Ltd Surges 5.05% to Day's High of Rs 1784.95 — Outperforms Realty Sector by 2.37 Percentage Points
2026-06-15 10:21:15The Sensex advanced 1.42% on 15 Jun 2026, yet Godrej Properties Ltd outpaced the broader market with a 5.05% gain, touching an intraday high of Rs 1784.95. This 2.37-percentage-point outperformance over the Realty sector’s 2.68% rise signals a distinctly stock-specific momentum shift rather than a mere market tailwind.
Read full news article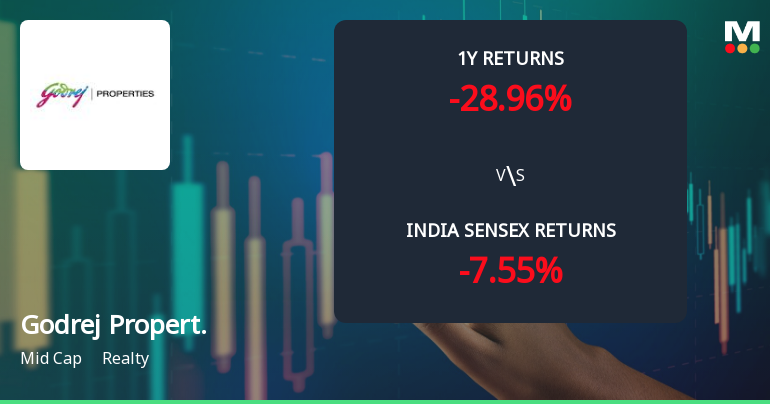
Godrej Properties Ltd Faces Bearish Momentum Amid Mixed Technical Signals
2026-06-15 08:02:53Godrej Properties Ltd, a mid-cap player in the realty sector, has seen a notable shift in its technical momentum, with recent indicators signalling a bearish trend despite some mildly bullish weekly signals. The stock’s current price movement, combined with its technical parameters and relative performance against the Sensex, paints a complex picture for investors navigating the real estate market in 2026.
Read full news article
Godrej Properties Ltd is Rated Strong Sell
2026-06-13 10:10:36Godrej Properties Ltd is rated Strong Sell by MarketsMOJO, with this rating last updated on 03 Nov 2025. However, the analysis and financial metrics discussed here reflect the company’s current position as of 13 June 2026, providing investors with an up-to-date view of the stock’s fundamentals, valuation, financial trends, and technical outlook.
Read full news article
Godrej Properties Ltd is Rated Strong Sell
2026-06-02 10:10:51Godrej Properties Ltd is rated Strong Sell by MarketsMOJO, with this rating last updated on 03 Nov 2025. However, the analysis and financial metrics discussed here reflect the stock’s current position as of 02 June 2026, providing investors with an up-to-date view of the company’s fundamentals, valuation, financial trends, and technical outlook.
Read full news article
Godrej Properties Sees Sharp Open Interest Surge Amid Mixed Market Signals
2026-05-29 15:00:11Godrej Properties Ltd (GODREJPROP) has witnessed a notable 13.14% increase in open interest (OI) in its derivatives segment, signalling heightened market activity and shifting investor positioning. Despite a marginal dip in the stock price, the surge in OI alongside rising volumes suggests evolving directional bets within the Realty sector, warranting close attention from traders and investors alike.
Read full news article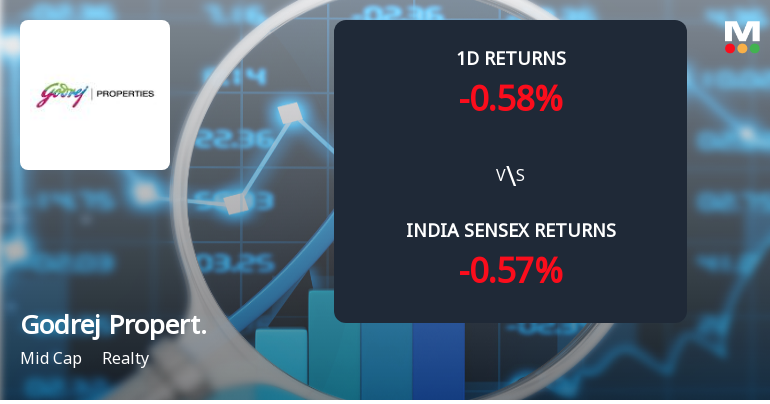
Godrej Properties Sees Sharp Open Interest Surge Amid Mixed Market Signals
2026-05-29 14:00:11Godrej Properties Ltd, a mid-cap player in the Realty sector, has witnessed a notable 10.78% increase in open interest (OI) in its derivatives segment, signalling heightened market activity and shifting investor positioning despite the stock’s underperformance relative to its sector and benchmark indices.
Read full news article
Godrej Properties Sees Sharp Open Interest Surge Amid Mixed Market Signals
2026-05-22 15:00:35Godrej Properties Ltd has witnessed a notable 10.2% increase in open interest in its derivatives segment, signalling heightened market activity and shifting investor positioning. Despite a marginal decline in the stock price, the surge in open interest and volume points to evolving directional bets within the mid-cap Realty sector.
Read full news article


