

Key Events This Week
15 Jun: Technical momentum upgrade to bullish
16 Jun: Valuation grade improved to attractive; strong 4.26% price gain
17 Jun: Technical momentum shifts to mildly bullish amid 3.97% price rise
18-19 Jun: Minor price corrections with volume decline
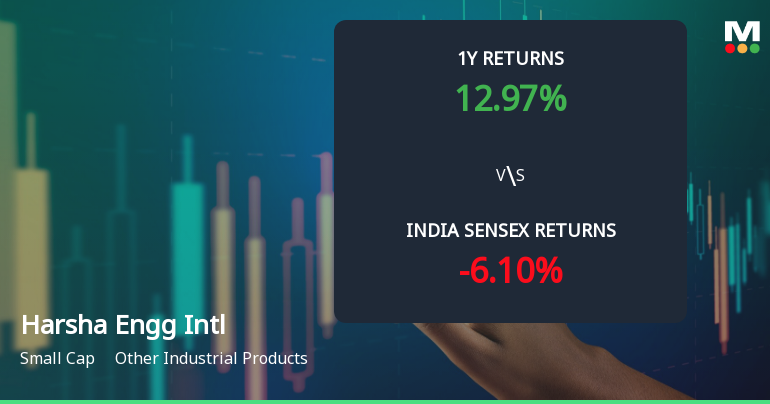
Harsha Engineers International Ltd Sees Technical Momentum Shift Amid Strong Price Gains
2026-06-17 08:06:35Harsha Engineers International Ltd has demonstrated a notable shift in its technical momentum, moving from a bullish to a mildly bullish stance, supported by a blend of positive and mixed signals across key indicators such as MACD, RSI, Bollinger Bands, and moving averages. This evolving technical landscape, combined with strong recent price performance, suggests a cautiously optimistic outlook for investors in this small-cap industrial player.
Read full news article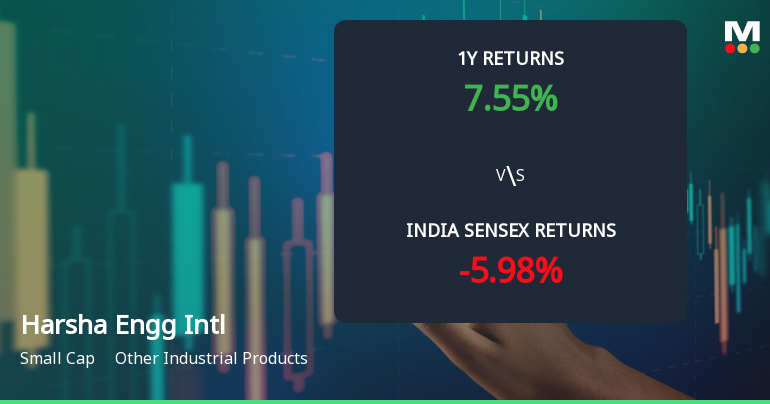
Harsha Engineers International Ltd Technical Momentum Shifts Signal Bullish Outlook
2026-06-16 08:07:35Harsha Engineers International Ltd has demonstrated a notable shift in price momentum, supported by a series of bullish technical indicators and an upgraded rating from Hold to Buy. The stock’s recent performance, coupled with positive signals from MACD, moving averages, and Bollinger Bands, suggests a strengthening trend that investors should closely monitor.
Read full news article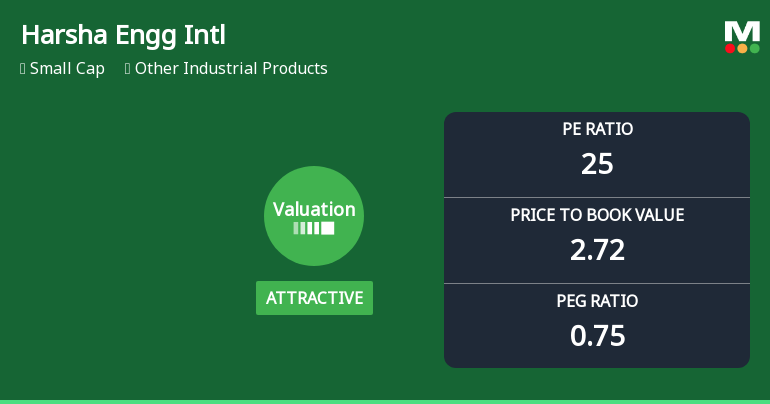
Harsha Engineers International Ltd: Valuation Shift Enhances Price Attractiveness Amid Sector Challenges
2026-06-16 08:02:18Harsha Engineers International Ltd has witnessed a notable upgrade in its valuation parameters, shifting from a very attractive to an attractive rating. This change reflects a positive reassessment of the company’s price metrics relative to its historical averages and peer group, signalling enhanced price attractiveness for investors amid a backdrop of solid operational performance and sector dynamics.
Read full news articleHarsha Engineers International Ltd’s Mixed Week: -0.62% Price Change Amid Technical Shifts
2026-06-13 10:00:06
Key Events This Week
8 June: Stock opens at Rs.405.50, declines 1.59% amid broader market weakness
9 June: Technical momentum shifts from mildly bearish to sideways, stock at Rs.399.05
10 June: Golden Cross formation signals potential bullish breakout, stock closes at Rs.401.25
11 June: Momentum shifts to mildly bullish, price rises 1.24% to Rs.401.25
12 June: Stock rebounds strongly, closing at Rs.403.00 (+2.10%) as Sensex surges

Harsha Engineers International Ltd is Rated Hold
2026-06-11 10:10:04Harsha Engineers International Ltd is rated 'Hold' by MarketsMOJO, with this rating last updated on 07 May 2026. However, the analysis and financial metrics discussed here reflect the company’s current position as of 11 June 2026, providing investors with the latest insights into its performance and outlook.
Read full news article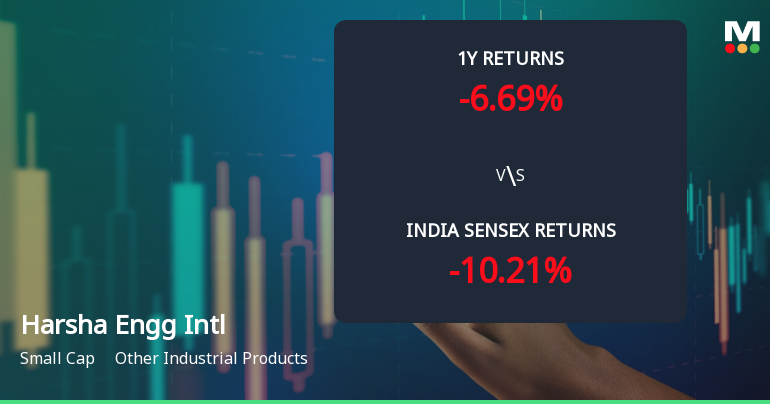
Harsha Engineers International Ltd Technical Momentum Shifts to Mildly Bullish
2026-06-11 08:05:27Harsha Engineers International Ltd has exhibited a notable shift in its technical momentum, moving from a mildly bearish stance to a mildly bullish outlook. This transition is underscored by a combination of technical indicators, including MACD, RSI, moving averages, and volume-based metrics, signalling a nuanced but positive change in the stock’s near-term trajectory.
Read full news article
Golden Cross Confirmed: Do Harsha Engineers International Ltd's Other Technical Indicators Agree?
2026-06-10 18:01:09The 50-day moving average has crossed above the 200-day moving average for Harsha Engineers International Ltd on 10 Jun 2026, signalling a golden cross. Yet, the broader technical picture is nuanced, with weekly indicators mostly bullish but monthly momentum showing mild bearishness. This divergence raises questions about the strength of the signal and whether it stands alone or is supported by other data.
Read full news article


