
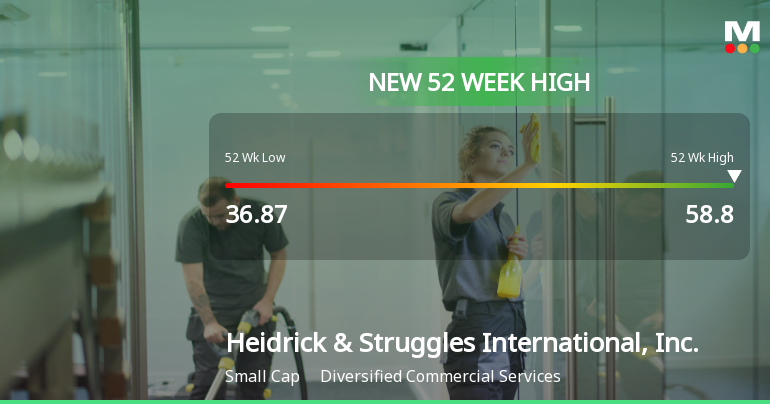
Heidrick & Struggles Hits New 52-Week High of $58.80
2025-11-04 17:49:57Heidrick & Struggles International, Inc. achieved a new 52-week high of USD 58.80 on November 3, 2025, reflecting strong performance in the diversified commercial services sector. With a market cap of USD 1,043 million, the company shows favorable financial metrics, including a P/E ratio of 11.00 and a dividend yield of 115.13%.
Read More
Heidrick & Struggles Hits New 52-Week High of $58.43
2025-10-14 18:44:19Heidrick & Struggles International, Inc. achieved a new 52-week high of USD 58.43, reflecting strong performance in the diversified commercial services sector. With a market cap of USD 1,043 million, the company has a favorable P/E ratio, impressive dividend yield, and solid return on equity, indicating operational efficiency and a strong balance sheet.
Read More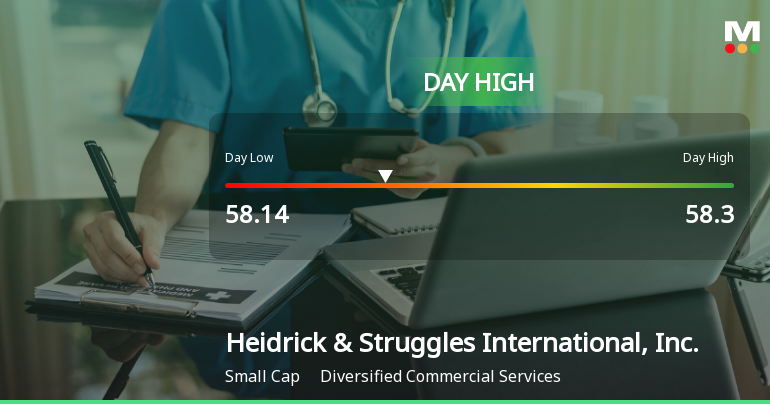
Heidrick & Struggles Stock Soars 19.54% to Day High of $58.30
2025-10-08 17:23:11Heidrick & Struggles International, Inc. has seen a notable increase in its stock price, reaching an intraday high of USD 58.30. Over the past year, the company has delivered a 55.55% return, significantly outperforming the S&P 500. Strong financial metrics include a 17.28% return on equity and robust cash flow.
Read More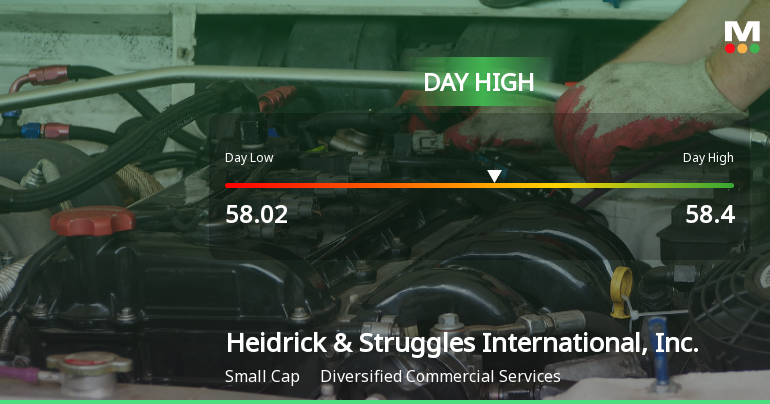
Heidrick & Struggles Hits Day High with 19.6% Surge in Stock Price
2025-10-07 22:26:44Heidrick & Struggles International, Inc. has shown notable market activity, achieving a significant stock increase on October 6, 2025. Over the past year, the company has outperformed the S&P 500, boasting impressive returns and strong financial metrics, including high operating cash flow and net profit figures.
Read More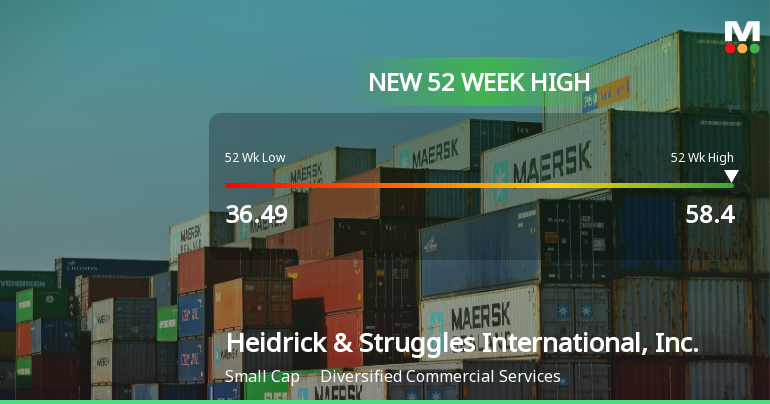
Heidrick & Struggles Hits New 52-Week High at $58.40
2025-10-07 21:43:12Heidrick & Struggles International, Inc. achieved a new 52-week high of USD 58.40 on October 6, 2025, reflecting strong performance in the diversified commercial services sector. The company has a market capitalization of USD 1,043 million, a favorable P/E ratio of 11.00, and a notable dividend yield of 115.13%.
Read More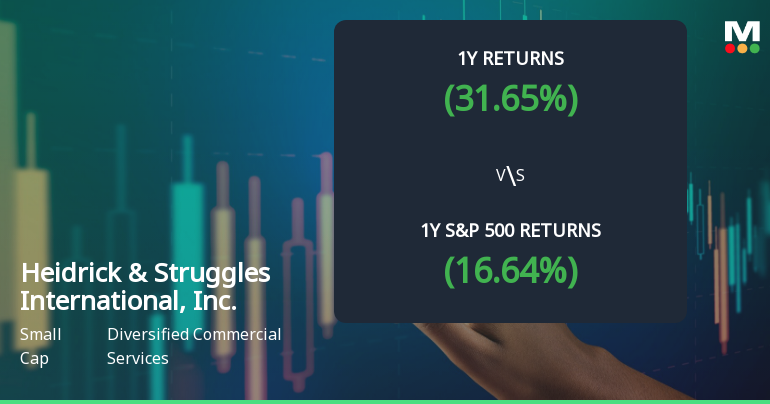
Heidrick & Struggles International, Inc. Experiences Revision in Stock Evaluation Amid Strong Market Performance
2025-09-23 15:58:55Heidrick & Struggles International, Inc. has recently revised its evaluation amid current market dynamics. The stock is trading at $50.16, with a 52-week range of $36.49 to $52.17. The company has demonstrated strong performance, outperforming the S&P 500 over various timeframes, showcasing its competitive positioning.
Read MoreIs Heidrick & Struggles International, Inc. technically bullish or bearish?
2025-09-23 11:20:04As of 19 September 2025, the technical trend for Heidrick & Struggles International, Inc. has changed from bullish to mildly bullish. The weekly MACD and Bollinger Bands are bullish, while the monthly MACD is also bullish, indicating positive momentum. However, the KST shows a mildly bearish stance on a monthly basis, and there are no clear trends indicated by Dow Theory or OBV. In terms of performance, the stock has outperformed the S&P 500 over the 1-year (31.65% vs. 16.64%) and 3-year (91.89% vs. 70.89%) periods, but has underperformed over the 1-month (-3.14% vs. 3.95%) and 10-year (150.17% vs. 240.36%) periods. Overall, the current stance is mildly bullish with some mixed signals....
Read MoreIs Heidrick & Struggles International, Inc. technically bullish or bearish?
2025-09-22 18:06:20As of 19 September 2025, the technical trend for Heidrick & Struggles International, Inc. has changed from bullish to mildly bullish. The weekly MACD remains bullish, while the daily moving averages indicate a bullish stance. However, the weekly RSI is bearish, and both the KST and OBV show mixed signals with the KST being bullish weekly but mildly bearish monthly, and the OBV indicating a mildly bearish trend weekly. The Bollinger Bands reflect a mildly bullish outlook on both weekly and monthly time frames. In terms of performance, the stock has returned 28.26% over the past year, significantly outperforming the S&P 500's 16.64% return. However, it has underperformed the S&P 500 over the last week and month. Overall, the current technical stance is mildly bullish, driven by the bullish MACD and daily moving averages, despite some bearish signals from the RSI and Dow Theory....
Read MoreIs Heidrick & Struggles International, Inc. technically bullish or bearish?
2025-09-20 19:40:50As of 10 September 2025, the technical trend for Heidrick & Struggles International, Inc. has changed from bullish to mildly bullish. The current stance is mildly bullish, supported by bullish signals from the MACD and Bollinger Bands on both weekly and monthly time frames, along with a bullish daily moving average. However, the KST indicates a mildly bearish monthly trend, and the Dow Theory shows a mildly bearish weekly trend. The stock has outperformed the S&P 500 across multiple periods, with a 1-year return of 35.47% compared to the S&P 500's 17.14%....
Read More
Corporate Actions


