
 News and Views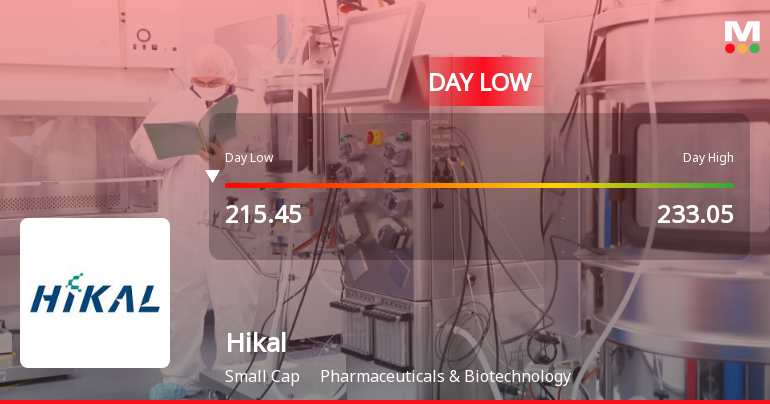
Key Events This Week
31 Aug: Stock opens week at Rs.201.75, down 1.15%
1 Sep: Technical momentum shifts amid bearish signals
3 Sep: Intraday high surge of 11.89%, closing at Rs.241.20 (+19.97%)
4 Sep: Shares hit intraday low amid price pressure, closing at Rs.222.20 (-7.88%)
Hikal Ltd Gains 1.22%: 5 Key Factors Driving the Week’s Mixed Momentum
2026-09-12 17:07:30
Key Events This Week
7 Sep: Intraday high surge to Rs.236.60 with 10.96% gain
7 Sep: Heavy volume and institutional buying push price to Rs.241.49
8 Sep: Mojo Score upgraded to Hold amid bullish technical shift
11 Sep: Mildly bullish momentum with 2.43% decline to Rs.234.95
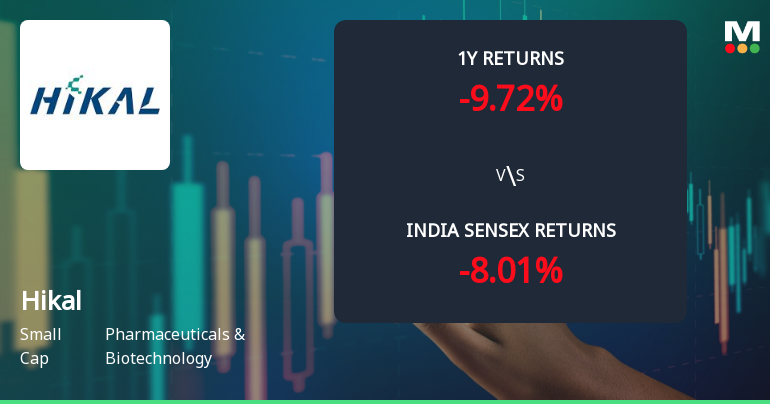
11 Sep: Week closes at Rs.224.90, outperforming Sensex
Hikal Ltd Technical Momentum Shifts Amid Mixed Market Signals
2026-09-11 08:00:35Hikal Ltd, a small-cap player in the Pharmaceuticals & Biotechnology sector, has experienced a nuanced shift in its technical momentum, moving from a bullish to a mildly bullish stance. Despite a recent dip in price, key indicators such as MACD and moving averages suggest a cautiously optimistic outlook, while other signals like KST and Bollinger Bands present a more complex picture for investors to consider.
Read full news article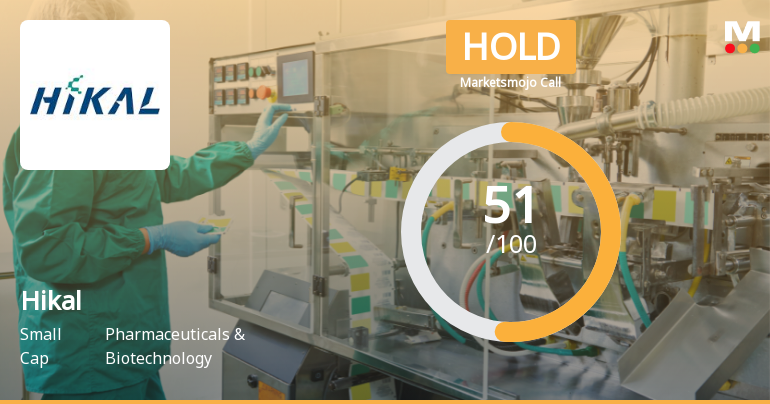
Hikal Ltd Upgraded to Hold by MarketsMOJO Amid Mixed Financial and Technical Signals
2026-09-08 08:29:51Hikal Ltd, a small-cap player in the Pharmaceuticals & Biotechnology sector, has seen its investment rating upgraded from Sell to Hold as of 7 September 2026. This change reflects a notable improvement in technical indicators amid persistent financial headwinds, prompting a reassessment of the stock’s near-term outlook despite ongoing fundamental concerns.
Read full news article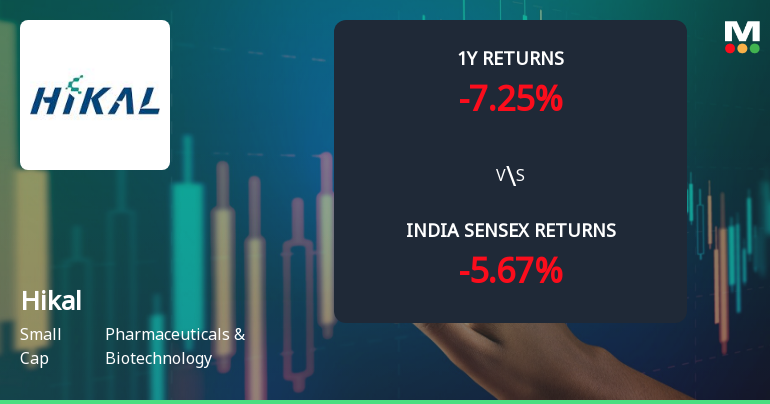
Hikal Ltd Technical Momentum Shifts to Bullish Amid Strong Price Gains
2026-09-08 08:00:41Hikal Ltd has witnessed a significant shift in its technical momentum, moving from a mildly bullish to a bullish stance, supported by strong daily moving averages and positive MACD signals. This technical upgrade accompanies a robust 9.38% surge in the stock price, reflecting renewed investor confidence in the pharmaceuticals and biotechnology sector amid broader market fluctuations.
Read full news article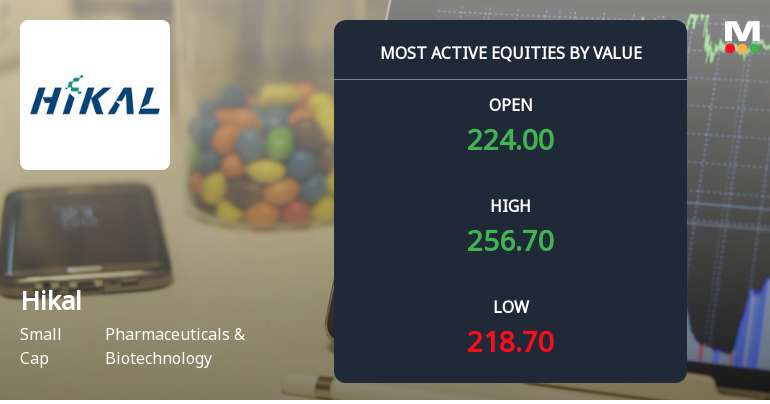
Hikal Ltd Surges on Heavy Value Trading and Institutional Interest
2026-09-07 15:00:07Hikal Ltd, a small-cap player in the Pharmaceuticals & Biotechnology sector, witnessed a remarkable surge in trading activity on 7 September 2026, driven by substantial value turnover and heightened institutional participation. The stock outperformed its sector and the broader market, reflecting renewed investor confidence despite a recent downgrade in its Mojo Grade.
Read full news article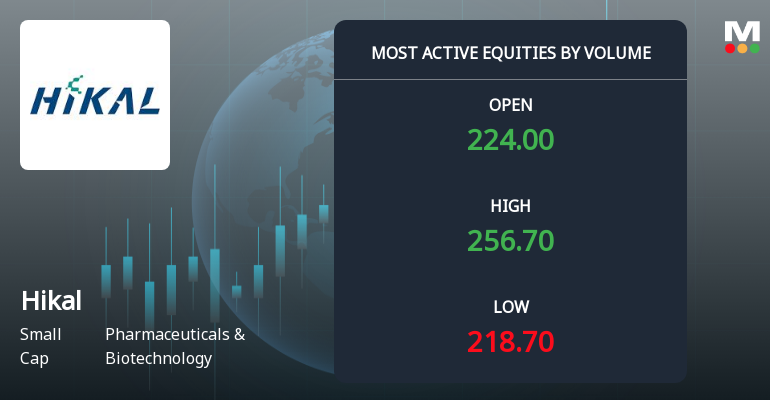
Hikal Ltd Surges on Exceptional Volume Amid Sector Outperformance
2026-09-07 15:00:07Hikal Ltd witnessed a remarkable surge in trading volume on 7 September 2026, emerging as one of the most actively traded stocks in the Pharmaceuticals & Biotechnology sector. The stock outperformed its sector peers and the broader market, driven by strong investor participation and technical momentum despite a recent downgrade in its Mojo Grade.
Read full news article










