

Hitech Corporation Ltd Technical Momentum Shifts Signal Bullish Outlook
2026-07-16 08:01:29Hitech Corporation Ltd, a micro-cap player in the packaging sector, has witnessed a notable shift in its technical momentum, upgrading its technical trend from mildly bullish to bullish. This change is underpinned by a confluence of positive signals from key indicators such as MACD, moving averages, and Bollinger Bands, despite some bearish nuances in the RSI readings. The company’s recent performance and technical upgrades suggest a cautiously optimistic outlook for investors seeking exposure in the packaging industry.
Read full news article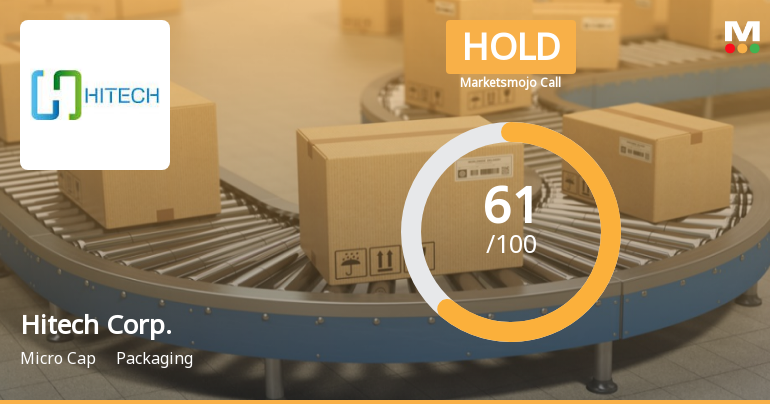
Hitech Corporation Ltd is Rated Hold
2026-07-15 10:10:33Hitech Corporation Ltd is rated 'Hold' by MarketsMOJO, with this rating last updated on 29 May 2026. However, the analysis and financial metrics discussed here reflect the stock's current position as of 15 July 2026, providing investors with an up-to-date view of the company’s fundamentals, valuation, financial trends, and technical outlook.
Read full news article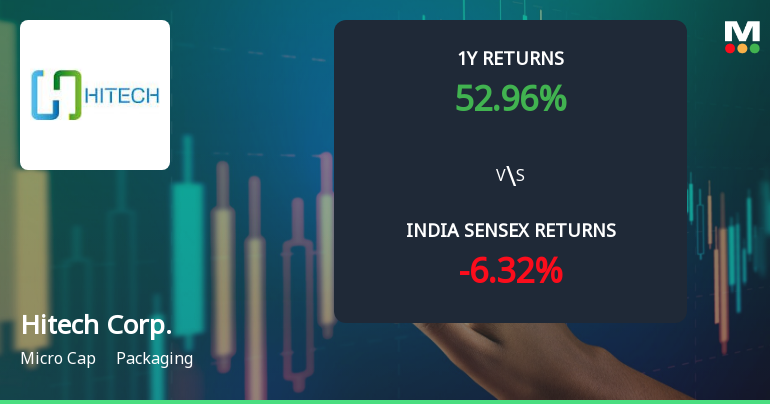
Hitech Corporation Ltd Technical Momentum Shifts Amid Mixed Indicator Signals
2026-07-15 08:01:47Hitech Corporation Ltd, a micro-cap player in the packaging sector, has experienced a nuanced shift in its technical momentum, reflecting a complex interplay of bullish and bearish signals across key indicators. Despite a recent downgrade from a Sell to a Hold rating by MarketsMOJO, the stock’s price action and technical parameters suggest a cautiously optimistic outlook amid mixed momentum cues.
Read full news article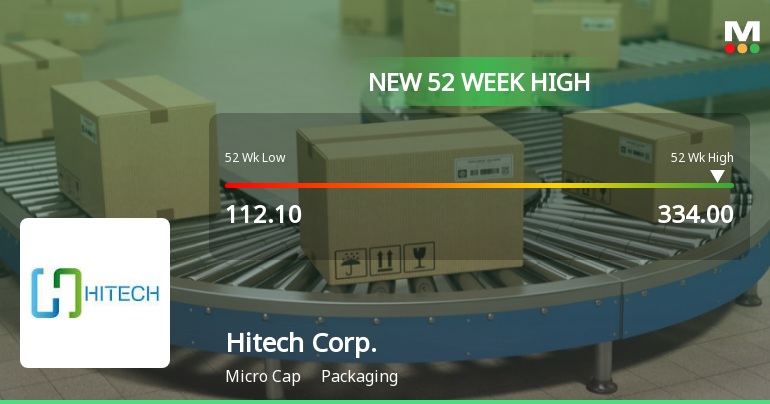
Broad-Based Technical Strength Lifts Hitech Corporation Ltd to 52-Week High of Rs 334
2026-07-10 09:45:40From a 52-week low of Rs 112.1 to a fresh high of Rs 334, Hitech Corporation Ltd has surged over 55% in the past year, significantly outperforming the Sensex which declined by 6.8% during the same period. This milestone reflects a powerful momentum driven by a confluence of bullish technical indicators and sustained price strength.
Read full news article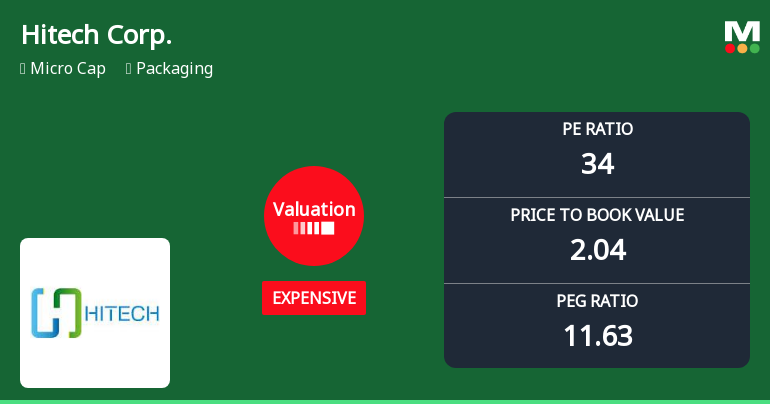
Hitech Corporation Ltd Valuation Shifts Signal Price Attractiveness Challenges
2026-07-10 08:00:22Hitech Corporation Ltd, a micro-cap player in the packaging sector, has seen a notable shift in its valuation parameters, moving from fair to expensive territory. This change, reflected in key metrics such as the price-to-earnings (P/E) ratio and price-to-book value (P/BV), raises questions about the stock’s price attractiveness relative to its historical averages and peer group. Despite strong returns year-to-date, investors should carefully analyse the implications of these valuation adjustments amid evolving market dynamics.
Read full news article
Broad-Based Technical Strength Lifts Hitech Corporation Ltd to 52-Week High of Rs 327.6
2026-07-09 13:15:14Surging past its previous peaks, Hitech Corporation Ltd touched an intraday high of Rs 327.6 on 9 Jul 2026, marking a significant milestone just 1.65% shy of its 52-week high of Rs 333. This rally is underpinned by a confluence of bullish technical indicators and sustained price momentum, setting the stage for a noteworthy breakout in the packaging sector.
Read full news article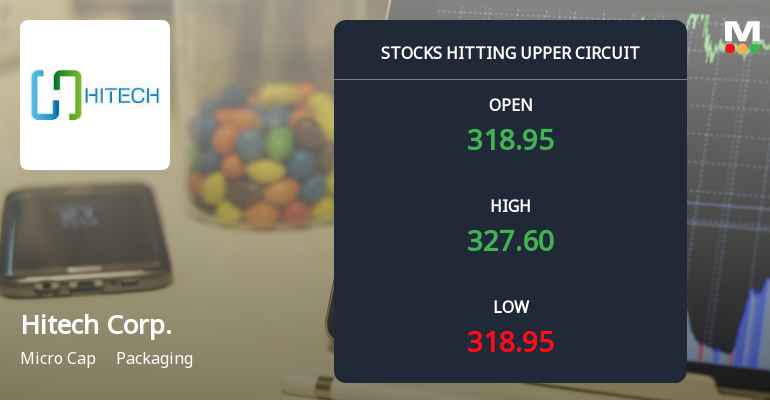
Hitech Corporation Ltd Locks at Upper Circuit With 5% Gain — Buyers Queue, Sellers Absent
2026-07-09 10:00:17At Rs 327.4, the buying was done — not because demand dried up, but because the exchange wouldn't let the stock go any higher. Hitech Corporation Ltd locked at its upper circuit of 5% on 08 Jul 2026, with buyers queuing and no sellers willing to part with shares.
Read full news article
Hitech Corporation Ltd Technical Momentum Shifts Signal Bullish Outlook Amid Mixed Indicators
2026-07-09 08:02:59Hitech Corporation Ltd, a micro-cap player in the packaging sector, has witnessed a notable shift in its technical momentum, moving from a mildly bullish stance to a more confident bullish trend. Despite a slight dip in the stock price on 9 July 2026, the underlying technical indicators reveal a complex but promising picture for investors analysing price momentum and trend sustainability.
Read full news article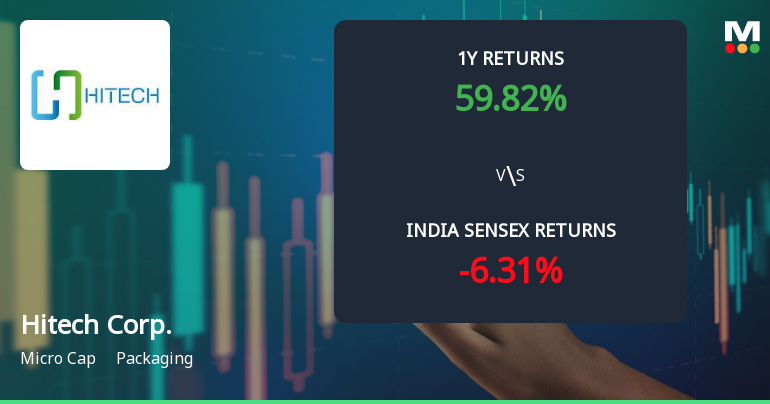
Hitech Corporation Ltd Technical Momentum Shifts Amid Mixed Indicator Signals
2026-07-08 08:02:41Hitech Corporation Ltd, a micro-cap player in the packaging sector, has experienced a nuanced shift in its technical momentum, moving from a bullish to a mildly bullish stance. Despite a modest decline in its share price to ₹315.00, down 1.05% on 8 July 2026, the stock’s technical indicators present a complex picture, with bullish signals from MACD and moving averages contrasting bearish RSI readings. This article analyses these developments in detail, placing them in the context of the company’s recent performance and broader market trends.
Read full news articleHitech Corporation Limited - Other General Purpose
28-Nov-2019 | Source : NSEHitech Corporation Limited has informed the Exchange regarding Disclosure on Related Party Transactions for the half year ended September 30, 2019, pursuant to Regulation 23(9) of SEBI (Listing Obligations and Disclosure Requirements) Regulations, 2015
Hitech Corporation Limited - Updates
18-Nov-2019 | Source : NSEHitech Corporation Limited has informed the Exchange regarding 'Publication of Financial Results of the Company for Second Quarter and Half Year ended 30th September, 2019 in Newspapers.'.
Hitech Corporation Limited - Outcome of Board Meeting
13-Nov-2019 | Source : NSEHitech Corporation Limited has informed the Exchange regarding Board meeting held on November 11, 2019.
Corporate Actions

No Upcoming Board Meetings

Hitech Corporation Ltd has declared 10% dividend, ex-date: 18 Jul 25

No Splits history available

No Bonus history available

No Rights history available


