Key Events This Week
15 Jun: Technical momentum shifts amid mixed indicator signals
16 Jun: Mojo Grade upgraded to Buy on improved technicals and financial metrics
17 Jun: Technical momentum shifts to sideways trend with mixed market signals
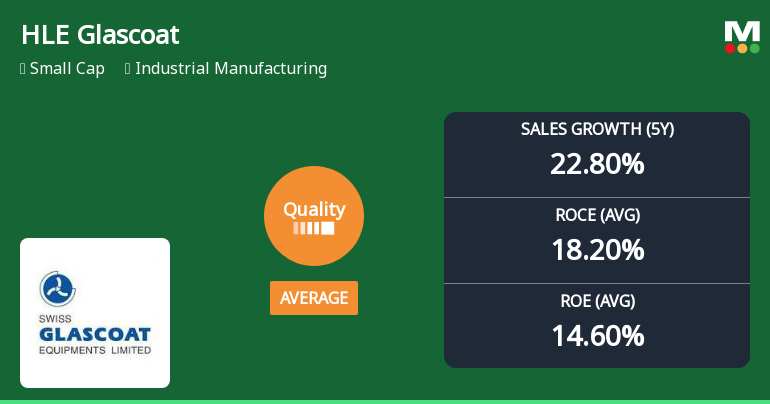
18 Jun: Quality grade downgraded from Good to Average; Mojo Grade downgraded to Hold
19 Jun: Technical momentum shifts to mildly bearish stance; Mojo Grade downgraded to Hold
Read full news article