
Key Events This Week
24 Aug: Stock opens at ₹333.65, down 0.36% amid weak market sentiment
25 Aug: Price rebounds to ₹334.95 (+0.39%) with increased volume
26 Aug: Technical upgrade to Hold by MarketsMOJO; stock closes at ₹336.00 (+0.31%)
27 Aug: Mixed technical signals emerge; price dips to ₹334.45 (-0.46%)
28 Aug: Momentum shifts to sideways; stock ends week at ₹333.25 (-0.36%)
IIFL Capital Services Ltd Technical Momentum Shifts Amid Mixed Indicators
2026-08-28 08:04:07IIFL Capital Services Ltd has experienced a notable shift in its technical momentum, moving from a mildly bullish stance to a sideways trend, reflecting a complex interplay of technical indicators. Despite a modest day decline of 0.46%, the stock’s broader technical signals reveal a nuanced outlook for investors navigating the capital markets sector.
Read full news article
IIFL Capital Services Ltd Upgraded to Hold by MarketsMOJO on Technical Improvements
2026-08-27 08:25:30IIFL Capital Services Ltd has seen its investment rating upgraded from Sell to Hold, reflecting a nuanced improvement across technical indicators, valuation metrics, financial trends, and overall quality. The company’s recent performance and market positioning have prompted analysts to revise their outlook, signalling cautious optimism amid a mixed financial backdrop.
Read full news article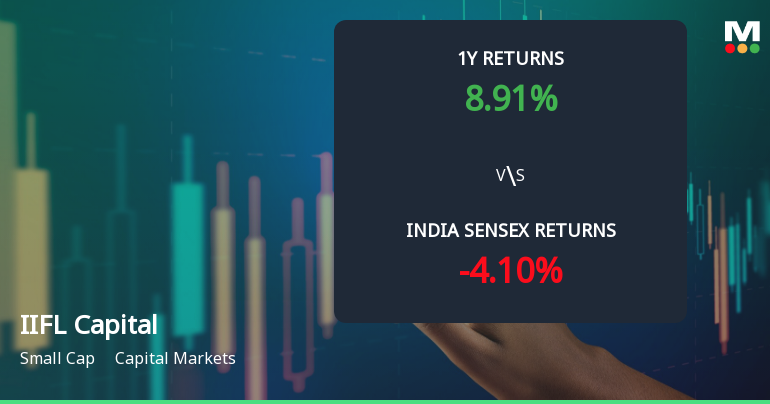
IIFL Capital Services Ltd Technical Momentum Shifts Amid Mixed Indicator Signals
2026-08-27 08:04:31IIFL Capital Services Ltd has exhibited a subtle shift in its technical momentum, moving from a sideways trend to a mildly bullish stance, reflecting nuanced changes in key technical indicators. Despite mixed signals from MACD, RSI, and moving averages, the stock’s recent performance and upgraded rating suggest cautious optimism among investors in the capital markets sector.
Read full news articleIIFL Capital Services Ltd Edges Up 0.01% Amid Technical Shift and Downgrade
2026-08-22 12:01:44
Key Events This Week
17 Aug: Stock opens at Rs.334.40, down 0.12% amid broader market weakness
19 Aug: Downgrade to Sell rating by MarketsMOJO citing technical weakness and flat financials
20 Aug: Technical momentum shifts from mildly bullish to sideways trend
21 Aug: Stock closes at Rs.334.85, up 0.56% on the day, ending the week flat
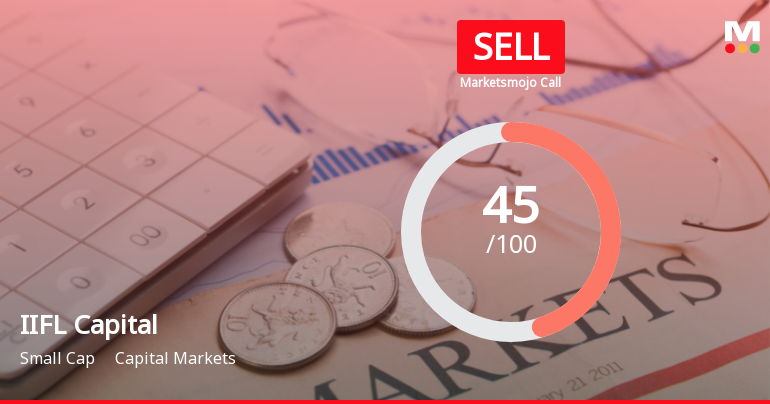
IIFL Capital Services Ltd Downgraded to Sell Amid Technical Weakness and Flat Financials
2026-08-20 08:28:42IIFL Capital Services Ltd, a small-cap player in the capital markets sector, has seen its investment rating downgraded from Hold to Sell as of 19 Aug 2026. This change reflects a combination of deteriorating technical indicators, flat recent financial performance, and valuation concerns despite the company’s strong long-term fundamentals and consistent returns relative to the broader market.
Read full news article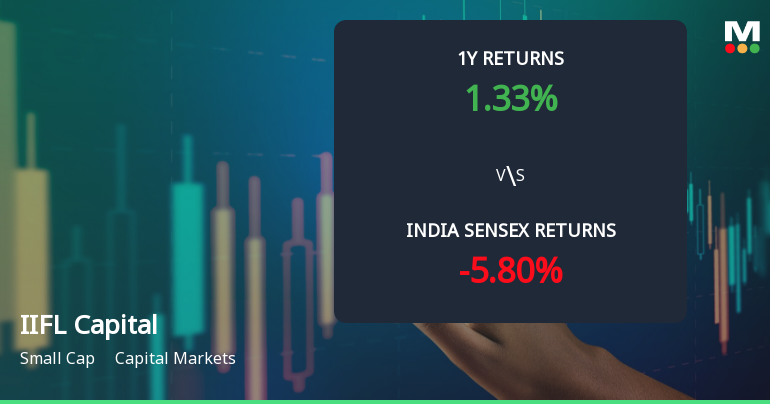
IIFL Capital Services Ltd Technical Momentum Shifts Amid Mixed Market Signals
2026-08-20 08:05:20IIFL Capital Services Ltd has experienced a notable shift in its technical momentum, transitioning from a mildly bullish stance to a sideways trend. This change is underscored by a complex interplay of technical indicators, including MACD, RSI, moving averages, and others, signalling a cautious outlook for investors amid mixed signals and a recent downgrade in its Mojo Grade to Sell.
Read full news article
 Announcement
Announcement Under Regulation 30 Of SEBI (LODR) Regulations 2015
11-Sep-2026 | Source : BSEAnnouncement under Regulation 30 of SEBI (LODR) Regulations 2015
Board Meeting Outcome for Outcome Of The Meeting Of Board Of Directors
11-Sep-2026 | Source : BSEOutcome of the Board Meeting held on September 11 2026
Shareholder Meeting / Postal Ballot-Scrutinizers Report
10-Sep-2026 | Source : BSEScrutinizers report and voting results of the 31st Annual General Meeting
Corporate ActionsCorporate Actions


No Upcoming Board Meetings

IIFL Capital Services Ltd has declared 150% dividend, ex-date: 16 Feb 26

No Splits history available

No Bonus history available

No Rights history available








