
Key Events This Week
15 Jun: Technical momentum shifts amid mixed indicator signals
17 Jun: Intraday high reached with 5.2% surge
18 Jun: Valuation upgraded to attractive amid market recovery
19 Jun: Week closes at Rs.35.12 (+5.31%) outperforming Sensex
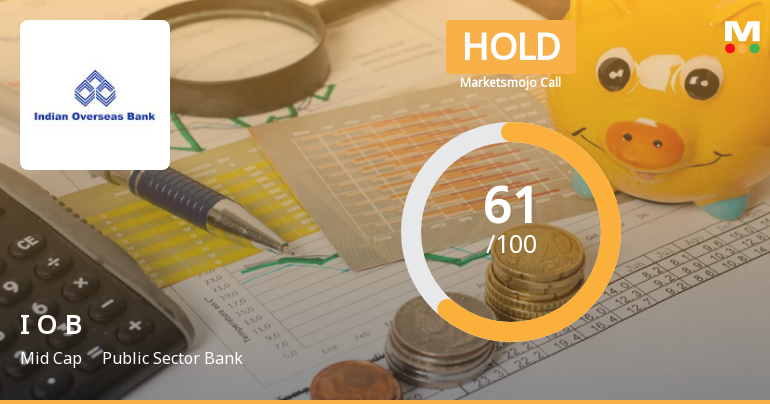
Indian Overseas Bank is Rated Hold by MarketsMOJO
2026-06-19 10:10:04Indian Overseas Bank is rated 'Hold' by MarketsMOJO, with this rating last updated on 30 March 2026. However, the analysis and financial metrics presented here reflect the stock's current position as of 19 June 2026, providing investors with an up-to-date view of the company’s fundamentals, valuation, financial trends, and technical outlook.
Read full news article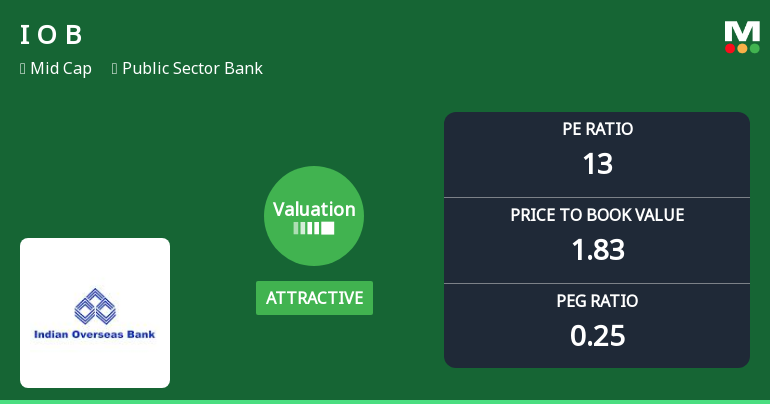
Indian Overseas Bank Valuation Shifts to Attractive Amid Market Recovery
2026-06-18 08:00:20Indian Overseas Bank (IOB) has witnessed a notable improvement in its valuation parameters, shifting from a very attractive to an attractive rating, reflecting a more compelling price proposition for investors. This upgrade accompanies a recent positive price movement and a revised Mojo Grade, signalling a potential turning point for this mid-cap public sector bank amid a mixed sectoral backdrop.
Read full news article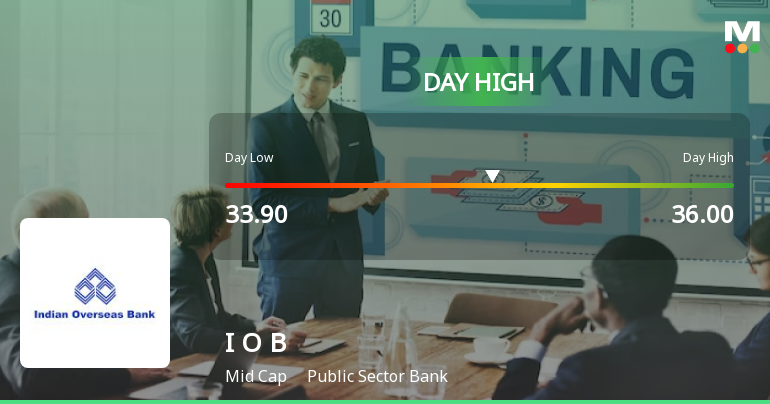
Indian Overseas Bank Rallies 5.2% and Approaches 200 DMA Resistance — A Key Technical Test Ahead
2026-06-17 13:16:30The Sensex edged up 0.14% while Indian Overseas Bank surged 5.2% on 17 Jun 2026, outperforming its Public Sector Bank peers by over 3 percentage points. This sharp single-session gain marks the fourth consecutive day of advances, cumulatively adding 10.5% in returns, signalling a notable shift in the stock’s short-term momentum.
Read full news article
Indian Overseas Bank Technical Momentum Shifts Amid Mixed Indicator Signals
2026-06-15 08:01:37Indian Overseas Bank (IOB) has exhibited a nuanced shift in its technical momentum, transitioning from a bearish stance to a mildly bearish outlook. This change is underscored by a complex interplay of technical indicators including MACD, RSI, Bollinger Bands, and moving averages, reflecting a cautious yet evolving market sentiment towards the public sector banking stock.
Read full news article
Indian Overseas Bank Technical Momentum Shifts to Bearish Amid Market Pressure
2026-06-12 08:01:25Indian Overseas Bank (IOB) has experienced a notable shift in its technical momentum, with key indicators signalling a bearish trend across multiple timeframes. Despite a recent upgrade in its Mojo Grade from Sell to Hold, the stock’s price action and technical parameters suggest caution for investors as downward pressures intensify.
Read full news article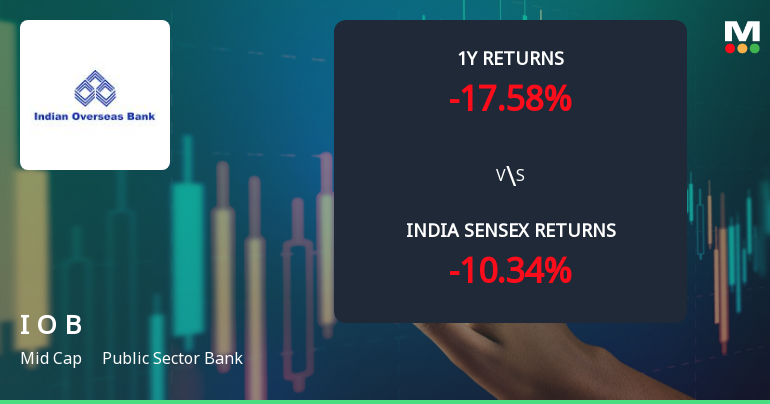
Indian Overseas Bank Technical Momentum Shifts Amid Mixed Market Signals
2026-06-10 08:01:58Indian Overseas Bank (IOB) has exhibited a subtle shift in its technical momentum, moving from a bearish stance to a mildly bearish outlook, as reflected in recent market data and technical indicators. Despite a modest day gain of 2.08%, the stock’s mixed signals across key metrics such as MACD, RSI, and moving averages suggest a nuanced picture for investors navigating the public sector banking space.
Read full news article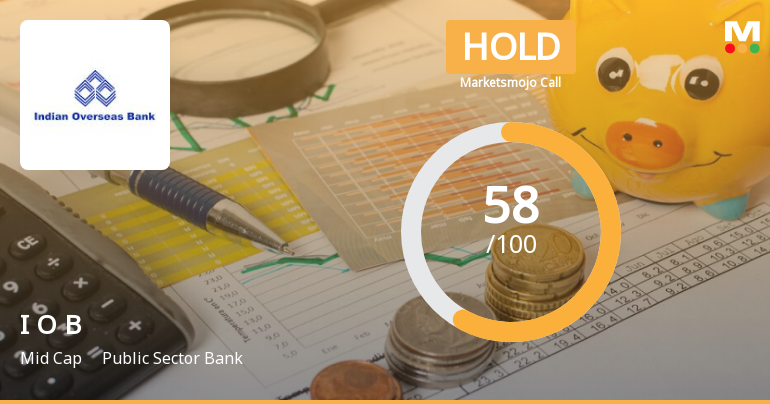
Indian Overseas Bank is Rated Hold by MarketsMOJO
2026-06-08 10:10:23Indian Overseas Bank is rated 'Hold' by MarketsMOJO, with this rating last updated on 30 March 2026. However, the analysis and financial metrics discussed below reflect the stock's current position as of 08 June 2026, providing investors with an up-to-date view of its performance and prospects.
Read full news article
Indian Overseas Bank is Rated Hold by MarketsMOJO
2026-06-07 10:10:20Indian Overseas Bank is rated 'Hold' by MarketsMOJO, with this rating last updated on 30 March 2026. However, the analysis and financial metrics discussed here reflect the stock's current position as of 08 June 2026, providing investors with an up-to-date perspective on the bank's performance and outlook.
Read full news article


