
 News and Views
Key Events This Week
10 Aug: Quality upgrade signals improved fundamentals but stock falls 4.00%
10 Aug: Valuation rating improves to attractive despite price decline
11 Aug: Downgrade to Sell amid flat financials and bearish technicals
12 Aug: Technical indicators confirm bearish momentum
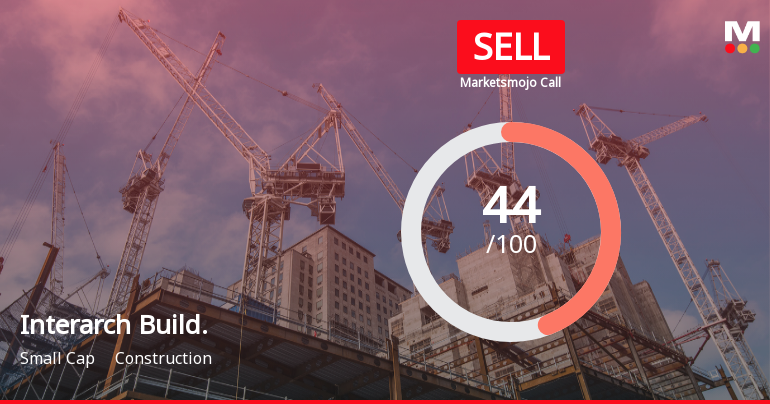
Interarch Building Solutions Ltd Downgraded to Sell Amid Flat Financials and Bearish Technicals
2026-08-12 08:45:44Interarch Building Solutions Ltd has seen its investment rating downgraded from Hold to Sell, reflecting a combination of flat financial trends, deteriorating technical indicators, and a shift in valuation perception. Despite maintaining a good quality grade, the company’s recent quarterly results and market performance have raised concerns among analysts, prompting a reassessment of its outlook within the construction sector.
Read full news article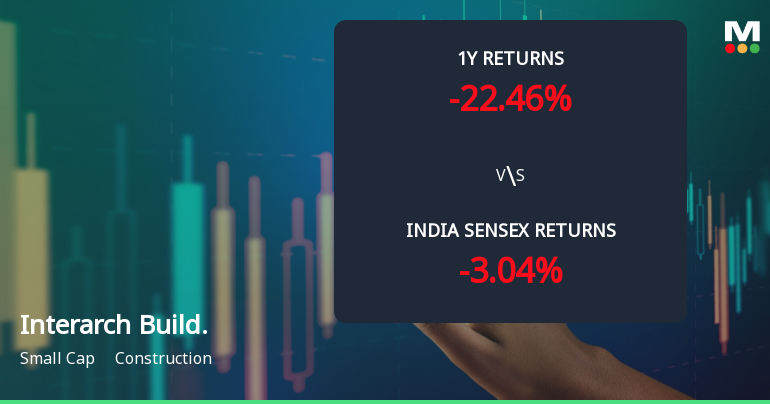
Interarch Building Solutions Ltd Faces Bearish Momentum Amid Technical Downgrade
2026-08-12 08:06:01Interarch Building Solutions Ltd has experienced a notable shift in its technical momentum, with key indicators signalling a bearish trend. The company’s recent downgrade from a Hold to a Sell rating by MarketsMOJO reflects growing concerns over its price performance and technical outlook amid a challenging construction sector environment.
Read full news article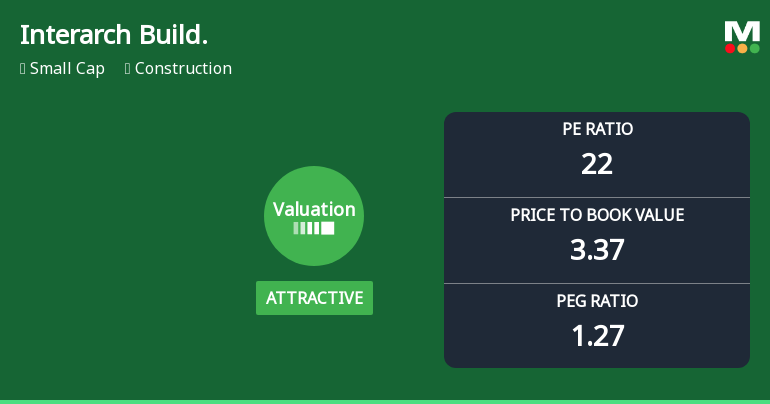
Interarch Building Solutions Ltd: Valuation Shifts Signal Renewed Price Attractiveness
2026-08-10 08:02:45Interarch Building Solutions Ltd has witnessed a notable shift in its valuation parameters, moving from a very attractive to an attractive rating, reflecting a changing market perception amid a challenging price performance year-to-date. This recalibration in valuation metrics offers investors a fresh perspective on the company’s price attractiveness relative to its historical averages and peer group within the construction sector.
Read full news article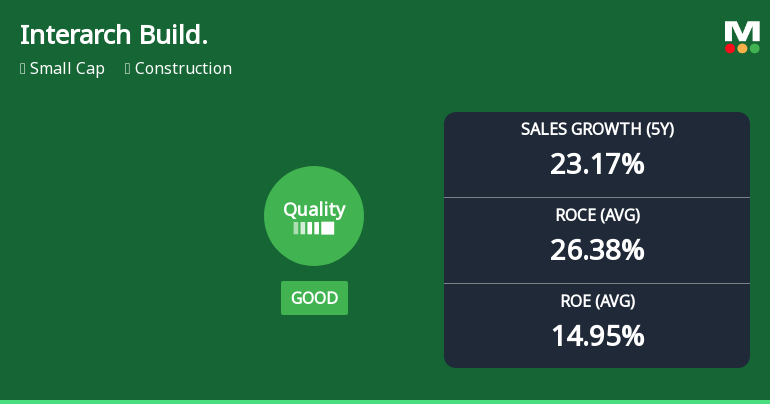
Interarch Building Solutions Ltd Quality Upgrade Signals Improved Business Fundamentals
2026-08-10 08:00:13Interarch Building Solutions Ltd has seen its quality rating upgraded from average to good, reflecting notable improvements in key business fundamentals such as return on equity (ROE), return on capital employed (ROCE), and debt management. Despite a challenging market environment and a recent share price decline, the company’s underlying financial health shows signs of strengthening, warranting a reassessment of its investment potential.
Read full news article
Interarch Building Solutions Ltd is Rated Hold
2026-08-09 10:10:40Interarch Building Solutions Ltd is rated 'Hold' by MarketsMOJO, with this rating last updated on 15 June 2026. However, the analysis and financial metrics discussed here reflect the company’s current position as of 09 August 2026, providing investors with an up-to-date view of its fundamentals, valuation, financial trends, and technical outlook.
Read full news article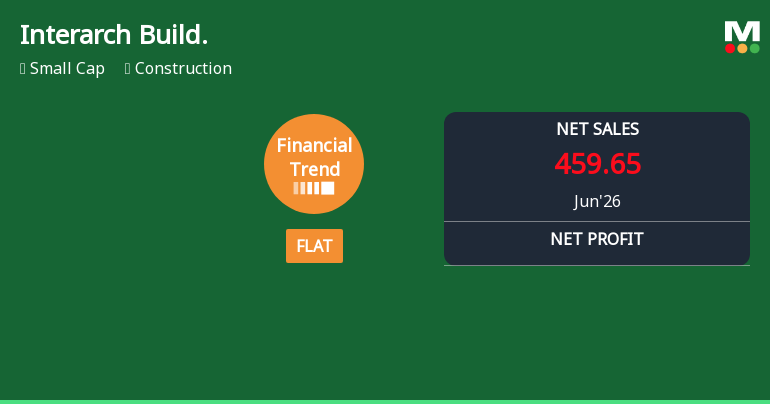
Interarch Building Solutions Ltd Reports Flat Quarterly Performance Amid Margin Pressure
2026-08-07 11:00:31Interarch Building Solutions Ltd, a small-cap player in the construction sector, has reported a flat financial performance for the quarter ended June 2026, signalling a notable shift from its previously positive growth trajectory. Despite robust revenue growth over the nine-month period, the company’s profitability metrics have deteriorated, prompting a downgrade in its Mojo Grade to Sell from Hold as of 15 June 2026.
Read full news article










