

Key Events This Week
13 Jul: Stock opens at ₹263.30, gains 0.84% to ₹265.50
14 Jul: Technical momentum shifts amid mixed indicator signals
17 Jul: Death Cross formation and downgrade to Sell rating
17 Jul: Mildly bearish technical shift despite marginal price gain
IRM Energy Ltd Forms Death Cross, Signalling Potential Bearish Trend
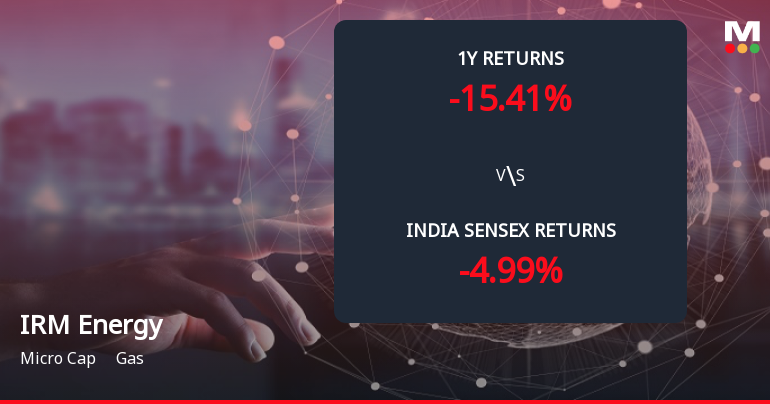
2026-07-17 18:00:34IRM Energy Ltd, a micro-cap player in the gas sector, has recently formed a Death Cross as its 50-day moving average (DMA) crossed below the 200-DMA, signalling a potential shift towards a bearish trend. This technical development, coupled with deteriorating momentum indicators and underwhelming price performance relative to the Sensex, raises concerns about the stock’s near- and long-term outlook.
Read full news article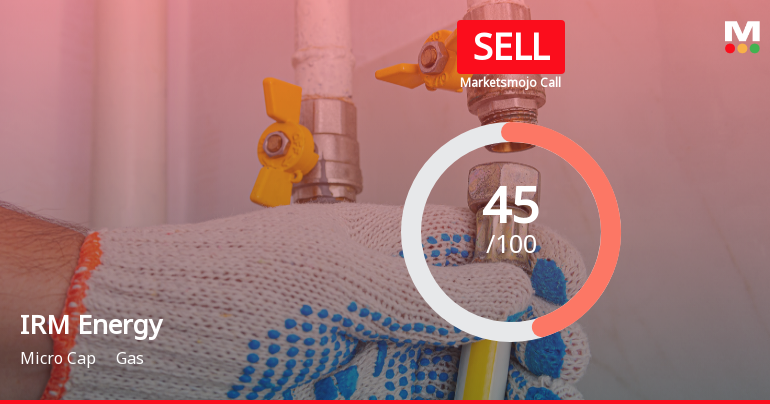
IRM Energy Ltd Downgraded to Sell Amid Technical Weakness and Long-Term Growth Concerns
2026-07-17 08:20:47IRM Energy Ltd, a micro-cap player in the gas transmission and marketing sector, has seen its investment rating downgraded from Hold to Sell as of 16 July 2026. This revision reflects a combination of deteriorating technical indicators, subdued long-term financial growth, and waning institutional interest, despite recent positive quarterly earnings.
Read full news article
IRM Energy Ltd Faces Mildly Bearish Technical Shift Amidst Mixed Momentum
2026-07-17 08:02:39IRM Energy Ltd has experienced a notable shift in its technical momentum, moving from a mildly bullish stance to a mildly bearish outlook. This change is underscored by deteriorating momentum indicators such as the MACD and RSI on both weekly and monthly charts, signalling caution for investors amid a challenging market environment for this micro-cap gas sector player.
Read full news article
IRM Energy Ltd Technical Momentum Shifts Amid Mixed Indicator Signals
2026-07-14 08:06:41IRM Energy Ltd, a micro-cap player in the gas sector, has exhibited a subtle shift in its technical momentum, moving from a sideways trend to a mildly bullish stance. This transition is underscored by mixed signals from key technical indicators such as MACD, RSI, Bollinger Bands, and moving averages, suggesting cautious optimism for investors amid a challenging market backdrop.
Read full news article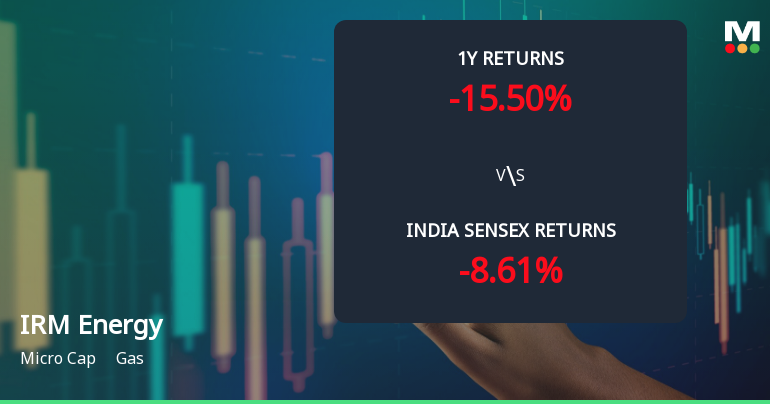
IRM Energy Ltd Technical Momentum Shifts Amid Mixed Market Signals
2026-07-09 08:06:53IRM Energy Ltd, a micro-cap player in the gas sector, has experienced a notable shift in its technical momentum, moving from a mildly bullish stance to a sideways trend. Recent technical indicators reveal a complex picture, with mixed signals from MACD, RSI, moving averages, and other momentum tools, reflecting uncertainty in the stock’s near-term trajectory.
Read full news article
IRM Energy Ltd is Rated Hold by MarketsMOJO
2026-07-06 10:10:05IRM Energy Ltd is rated 'Hold' by MarketsMOJO, with this rating last updated on 15 June 2026. However, the analysis and financial metrics discussed here reflect the company’s current position as of 06 July 2026, providing investors with the most recent insights into its performance and outlook.
Read full news articleIRM Energy Ltd Falls 5.61%: 3 Key Technical Signals Shaping the Week
2026-06-27 11:00:06
Key Events This Week
22 Jun: Technical momentum shifts amid mixed indicator signals
23 Jun: Formation of Golden Cross signalling potential bullish breakout
24 Jun: Technical momentum shifts amid mixed market signals
25 Jun: Week closes at Rs.265.10 (-5.61%)

Corporate Actions

No Upcoming Board Meetings

IRM Energy Ltd has declared 15% dividend, ex-date: 18 Sep 25

No Splits history available

No Bonus history available

No Rights history available


