
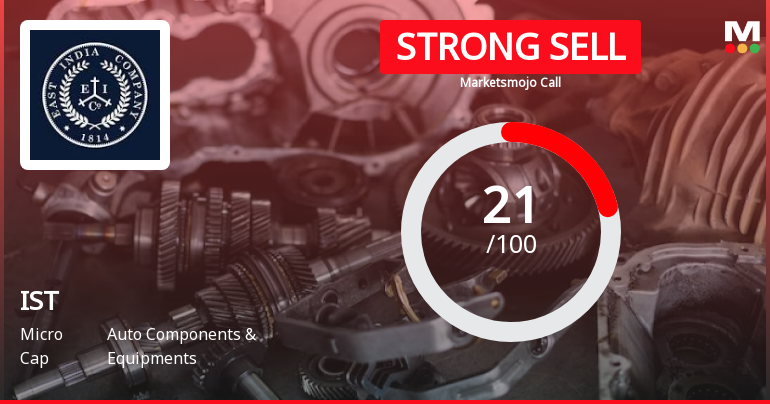
IST Ltd is Rated Strong Sell
2026-07-07 10:11:09IST Ltd is rated Strong Sell by MarketsMOJO, with this rating last updated on 04 June 2026. However, the analysis and financial metrics discussed here reflect the stock’s current position as of 07 July 2026, providing investors with the most up-to-date view of the company’s fundamentals, returns, and market performance.
Read full news article
IST Ltd is Rated Strong Sell by MarketsMOJO
2026-06-26 10:10:49IST Ltd is rated Strong Sell by MarketsMOJO, with this rating last updated on 04 June 2026. However, the analysis and financial metrics discussed here reflect the stock’s current position as of 26 June 2026, providing investors with the latest insights into the company’s performance and outlook.
Read full news article
IST Ltd Faces Intensified Downtrend Amid Technical Momentum Shift
2026-06-24 08:02:39IST Ltd, a micro-cap player in the Auto Components & Equipments sector, has experienced a notable shift in its technical momentum, with key indicators signalling a bearish trend. The stock’s recent price action and technical parameters reflect growing downside pressure, compounded by underperformance relative to the broader market benchmarks such as the Sensex.
Read full news article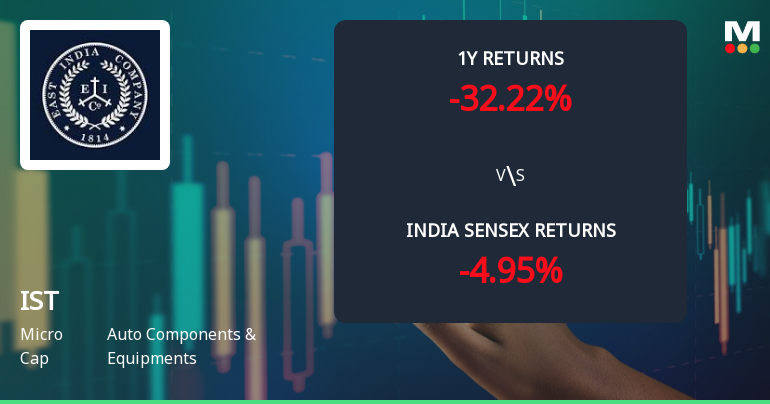
IST Ltd Technical Momentum Shifts Amid Mixed Indicator Signals
2026-06-19 08:01:29IST Ltd, a micro-cap player in the Auto Components & Equipments sector, has experienced a subtle shift in its technical momentum, moving from a bearish to a mildly bearish trend. Despite a modest 1.13% gain on 19 Jun 2026, the stock’s technical indicators present a complex picture, with some weekly signals showing mild bullishness while monthly trends remain bearish. This nuanced technical landscape warrants close attention from investors seeking to understand the stock’s near-term trajectory.
Read full news article
IST Ltd Faces Bearish Momentum Amid Technical Downgrade and Market Underperformance
2026-06-17 08:03:05IST Ltd, a micro-cap player in the Auto Components & Equipments sector, has witnessed a marked shift in its technical momentum, with key indicators signalling a bearish trend. The stock’s recent price action and technical parameters suggest growing downside risks, compounded by underperformance relative to benchmark indices and sector peers.
Read full news article
IST Ltd Technical Momentum Shifts Amid Mixed Market Signals
2026-06-16 08:03:50IST Ltd, a micro-cap player in the Auto Components & Equipments sector, has exhibited a nuanced shift in its technical momentum, reflecting a complex interplay of bullish and bearish signals across multiple timeframes. Despite a modest daily gain of 2.39%, the stock’s broader technical indicators suggest a cautious outlook, underscored by a recent downgrade in its MarketsMOJO mojo grade to Strong Sell.
Read full news article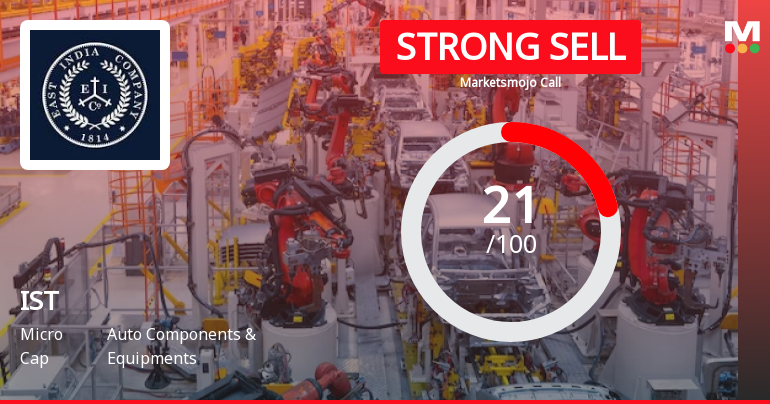
IST Ltd is Rated Strong Sell
2026-06-15 10:11:14IST Ltd is rated Strong Sell by MarketsMOJO, with this rating last updated on 04 June 2026. However, the analysis and financial metrics presented here reflect the stock's current position as of 15 June 2026, providing investors with the latest insights into the company’s performance and outlook.
Read full news article
IST Ltd Technical Momentum Shifts to Bearish Amidst Weak Price Performance
2026-06-15 08:02:54IST Ltd, a micro-cap player in the Auto Components & Equipments sector, has experienced a notable shift in its technical momentum, coinciding with a recent downgrade to a Strong Sell rating. The stock’s price action and technical indicators reveal a deteriorating trend, reflecting growing bearish sentiment despite some mildly bullish signals on shorter timeframes.
Read full news article
IST Ltd Technical Momentum Shifts Amid Mixed Market Signals
2026-06-12 08:02:38IST Ltd, a micro-cap player in the Auto Components & Equipments sector, has experienced a nuanced shift in its technical momentum, reflecting a complex interplay of bullish and bearish signals. Despite a modest day gain of 1.06%, the stock remains under pressure with a Strong Sell mojo grade, underscoring the challenges faced by investors navigating its current trend dynamics.
Read full news articleClosure of Trading Window
25-Jun-2026 | Source : BSEPlease find enclosed herewith the intimation for closure of trading window w.e.f. 01-07-2026
Compliances-Reg.24(A)-Annual Secretarial Compliance
30-May-2026 | Source : BSEIn compliance with Regulation 24A of the Listing Regulations (LODR) we are enclosing herewith the Annual Secretarial Compliance Report for the financial year ended 31st March 2026.
Announcement under Regulation 30 (LODR)-Newspaper Publication
30-May-2026 | Source : BSEPFA the Newspaper publication w.r.t. the abstract of audited financial results of the Company duly approved by the Board of directors on 29th May 2026. The abstract were publised by the Company in Financial Express(English) and Hari Bhoomi (Hindi) newspapers on 30th May 2026
Corporate Actions

No Upcoming Board Meetings

No Dividend history available

IST Ltd has announced 5:10 stock split, ex-date: 01 Nov 19

No Bonus history available

No Rights history available


