
Key Events This Week
22 Jun: Golden Cross formation signalling potential bullish breakout
23 Jun: Upgrade to Hold rating on technical and valuation improvements
23 Jun: Technical momentum shifts confirm bullish outlook
25 Jun: Week closes at ₹5,406.50 (+0.14%)

Kalyani Investment Company Ltd Upgraded to Hold on Technical and Valuation Improvements
2026-06-23 08:23:11Kalyani Investment Company Ltd has seen its investment rating upgraded from Sell to Hold, reflecting a notable improvement in technical indicators and valuation metrics despite flat recent financial performance. The company’s stock has demonstrated resilience with market-beating returns over multiple time horizons, prompting a reassessment of its investment appeal.
Read full news article
Kalyani Investment Company Ltd Technical Momentum Shifts Signal Bullish Outlook
2026-06-23 08:03:21Kalyani Investment Company Ltd has demonstrated a notable shift in its technical momentum, moving from a mildly bullish stance to a more confident bullish trend. This transition is underscored by a combination of positive signals from key technical indicators such as MACD, Bollinger Bands, and moving averages, suggesting an improving outlook for this small-cap NBFC stock amid a strong price rally.
Read full news article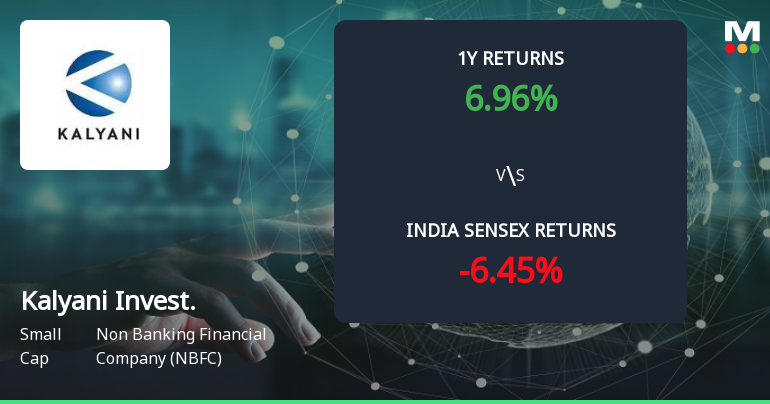
Kalyani Investment Company Ltd Forms Golden Cross Amid Mixed Technical Signals
2026-06-22 18:00:45The 50-day moving average for Kalyani Investment Company Ltd has crossed above the 200-day moving average, signalling a golden cross on 22 Jun 2026. Yet, this technical event arrives amid a complex backdrop of mixed momentum indicators and a small-cap profile, raising questions about the signal’s reliability in isolation.
Read full news article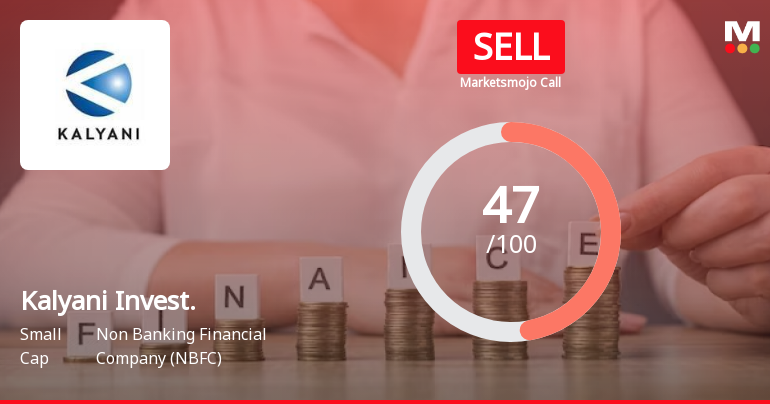
Kalyani Investment Company Ltd is Rated Sell
2026-06-20 10:10:03Kalyani Investment Company Ltd is rated Sell by MarketsMOJO, with this rating last updated on 26 May 2026. However, the analysis and financial metrics discussed here reflect the stock’s current position as of 20 June 2026, providing investors with the latest insights into its performance and outlook.
Read full news article
Kalyani Investment Company Ltd Shows Technical Momentum Shift Amid Mixed Indicators
2026-06-16 08:02:52Kalyani Investment Company Ltd, a small-cap player in the Non Banking Financial Company (NBFC) sector, has exhibited a notable shift in its technical momentum, moving from a mildly bearish to a mildly bullish trend. This change is underscored by a blend of bullish and mildly bearish signals across key technical indicators such as MACD, RSI, Bollinger Bands, and moving averages, suggesting a nuanced outlook for investors.
Read full news articleKalyani Investment Declines 1.88%: Mixed Financials and Sideways Technicals Shape Week
2026-06-14 09:00:55
Key Events This Week
1 June: Stabilised financial trend reported with mixed quarterly results
2 June: Technical momentum shifts to sideways trend amid mixed signals
5 June: Week closes at Rs.4,979.80 (-1.06% on day)
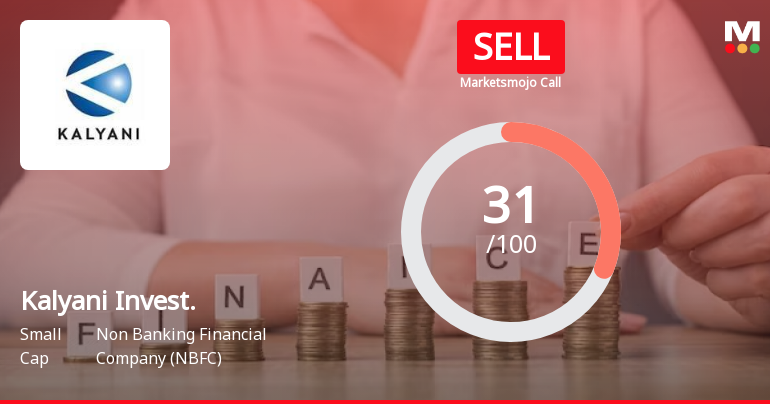
Kalyani Investment Company Ltd is Rated Sell
2026-06-09 10:11:04Kalyani Investment Company Ltd is rated 'Sell' by MarketsMOJO, with this rating last updated on 26 May 2026. However, the analysis and financial metrics discussed here reflect the stock's current position as of 09 June 2026, providing investors with the latest insights into the company’s performance and outlook.
Read full news article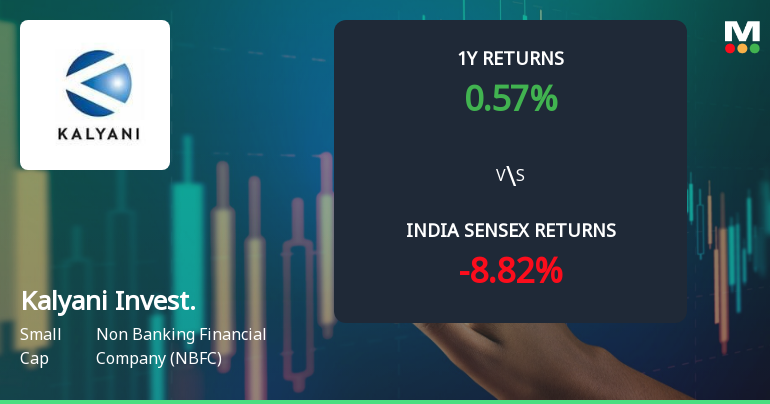
Kalyani Investment Company Ltd Technical Momentum Shifts Amid Sideways Trend
2026-06-02 08:03:54Kalyani Investment Company Ltd, a small-cap player in the Non Banking Financial Company (NBFC) sector, has experienced a notable shift in its technical momentum. Despite a recent downgrade in its Mojo Grade from Strong Sell to Sell, the stock exhibits a complex blend of bullish and bearish signals across key technical indicators, reflecting a sideways trend after a mildly bullish phase.
Read full news article


