
Key Events This Week
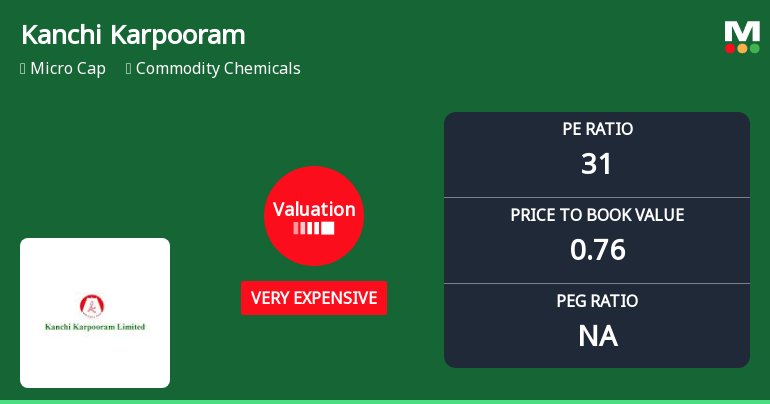
May 25: Valuation concerns raised amid elevated P/E of 32.43
May 26: Stock hits lower circuit limit at Rs.372.35 on heavy selling pressure
May 27: Continued price decline to Rs.372.00 despite Sensex gains
May 29: Week closes at Rs.371.95, down 3.41% for the week
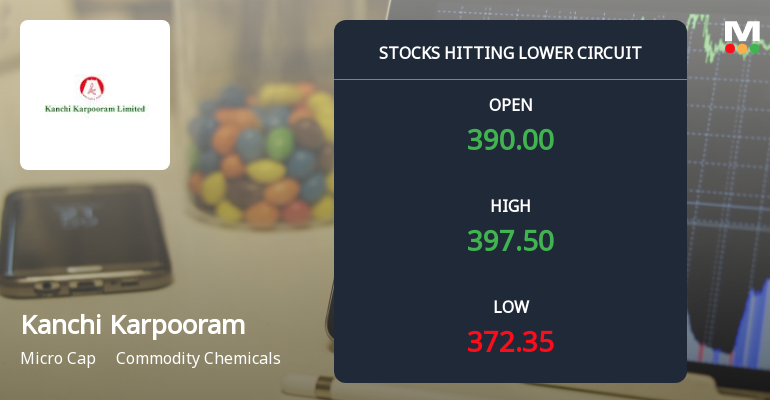
Kanchi Karpooram Ltd Locks at Lower Circuit With 4.99% Loss — Sellers Queue, No Buyers in Sight
2026-05-26 13:00:09At Rs 372.35, sellers were still queuing — but there were no buyers willing to take the other side. Kanchi Karpooram Ltd locked at its lower circuit of 4.99% on 26 May 2026, with unfilled sell orders and a frozen price.
Read full news article
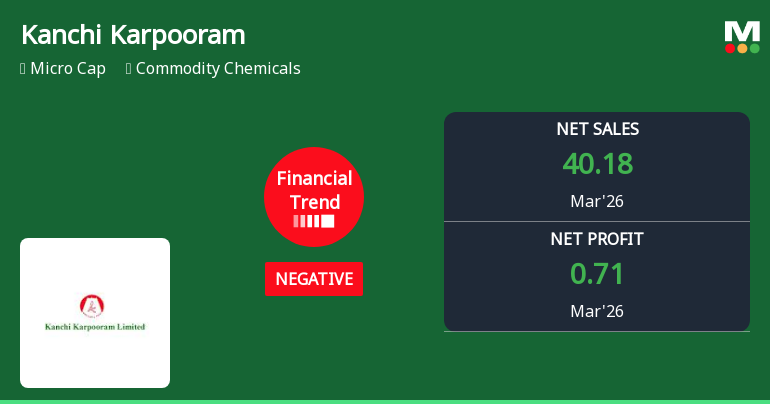
Kanchi Karpooram Ltd Valuation Shifts Signal Heightened Price Risk Amid Weak Returns
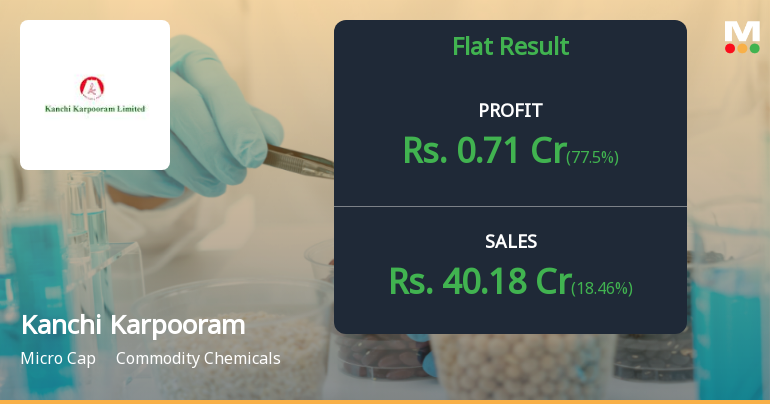
2026-05-25 08:00:44Kanchi Karpooram Ltd, a micro-cap player in the commodity chemicals sector, has seen a marked shift in its valuation parameters, moving from an expensive to a very expensive rating. Despite a modest day gain of 2.61%, the company’s elevated price-to-earnings (P/E) ratio and other valuation metrics raise questions about its price attractiveness relative to historical levels and peer benchmarks.
Read full news articleWhen is the next results date for Kanchi Karpooram Ltd?
2026-05-20 23:18:52The next results date for Kanchi Karpooram Ltd is scheduled for 29 May 2026....
Read full news article
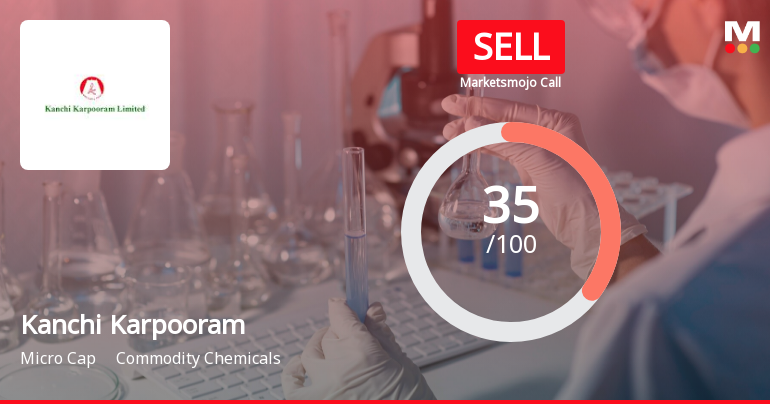
Kanchi Karpooram Ltd is Rated Strong Sell
2026-05-20 10:10:56Kanchi Karpooram Ltd is rated Strong Sell by MarketsMOJO, with this rating last updated on 16 Apr 2026. However, the analysis and financial metrics discussed here reflect the stock's current position as of 20 May 2026, providing investors with an up-to-date view of the company’s fundamentals, returns, and market performance.
Read full news article


