
Key Events This Week
8 Jun: MarketsMOJO upgrades KDDL Ltd to Hold on improved technicals and financials
8 Jun: Technical momentum shifts to bullish amid mixed indicators
10 Jun: Company reports record quarterly gains but financial trend turns flat
12 Jun: Stock rebounds 2.27% but closes the week lower overall
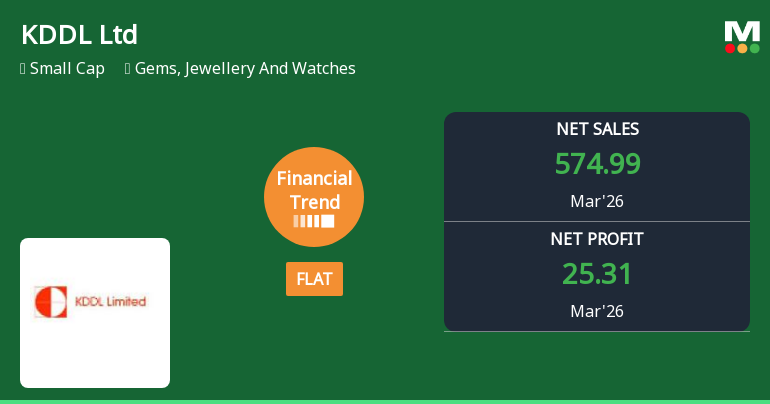
KDDL Ltd Reports Strong Quarterly Gains Amid Flat Financial Trend
2026-06-10 15:00:19KDDL Ltd, a small-cap player in the Gems, Jewellery and Watches sector, has delivered its highest quarterly performance in recent times, with significant growth in revenue and profitability metrics for the quarter ended March 2026. Despite this, the company’s overall financial trend has shifted from positive to flat, reflecting a nuanced outlook for investors.
Read full news article
KDDL Ltd Upgraded to Hold by MarketsMOJO on Improved Technicals and Financials
2026-06-08 08:05:50KDDL Ltd, a small-cap player in the Gems, Jewellery and Watches sector, has seen its investment rating upgraded from Sell to Hold, reflecting a marked improvement in technical indicators and a stabilising financial trend. The company’s Mojo Score has risen to 65.0, signalling a more balanced outlook amid a backdrop of strong long-term returns and recent positive quarterly results.
Read full news article
KDDL Ltd Technical Momentum Shifts Signal Bullish Outlook Amid Mixed Indicators
2026-06-08 08:00:48KDDL Ltd, a small-cap player in the Gems, Jewellery and Watches sector, has witnessed a notable shift in its technical momentum from mildly bearish to bullish, signalling a potential turnaround in price action despite a slight dip in the latest session. This change is underscored by a mix of technical indicators that suggest improving investor sentiment and a strengthening trend over multiple timeframes.
Read full news article
KDDL Ltd Technical Momentum Shifts Amid Mixed Indicator Signals
2026-06-04 08:01:39KDDL Ltd, a small-cap player in the Gems, Jewellery and Watches sector, has experienced a notable shift in its technical momentum, moving from a sideways trend to a mildly bearish stance. Despite a recent downgrade in its Mojo Grade from Strong Sell to Sell, the stock’s price action and technical indicators present a nuanced picture that investors should carefully analyse.
Read full news article
KDDL Ltd is Rated Sell by MarketsMOJO
2026-06-03 10:10:03KDDL Ltd is rated 'Sell' by MarketsMOJO, with this rating last updated on 20 May 2026. However, the analysis and financial metrics discussed here reflect the stock's current position as of 03 June 2026, providing investors with the most recent and relevant data to assess the company’s prospects.
Read full news article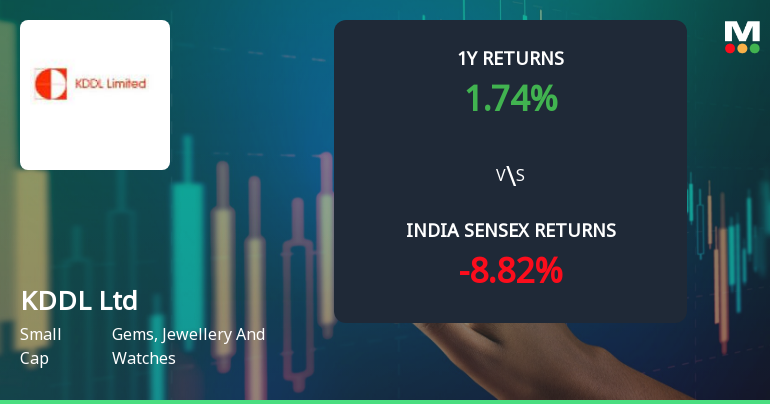
KDDL Ltd Technical Momentum Shifts Amid Mixed Indicator Signals
2026-06-02 08:03:21KDDL Ltd, a small-cap player in the Gems, Jewellery and Watches sector, has experienced a notable shift in its technical momentum, moving from a sideways trend to a mildly bearish stance. Despite some bullish signals on weekly MACD and KST indicators, the overall technical landscape remains mixed, reflecting cautious investor sentiment amid recent price declines and a downgrade in its Mojo Grade to Sell.
Read full news article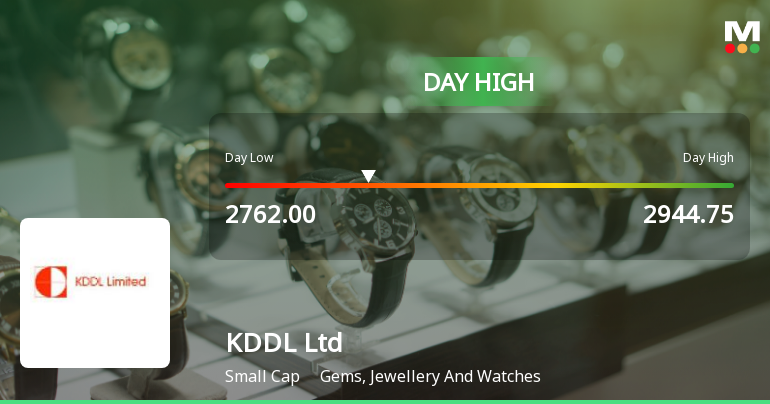
KDDL Ltd Surges 7.29% to Day's High of Rs 2944.75 — Outperforms Sector by 6.12 Percentage Points
2026-05-27 09:31:27The Sensex declined by 0.1% on 27 May 2026, while KDDL Ltd surged 7.29%, outperforming its sector by 6.12 percentage points. This sharp single-session gain stands out as a stock-specific event amid a broadly weak market backdrop, signalling a noteworthy shift in the short-term price dynamics of this small-cap gem in the Gems, Jewellery And Watches sector.
Read full news article


