
Is Liminatus Pharma, Inc. technically bullish or bearish?
2025-09-20 20:34:59As of 1 October 2023, the technical trend for Liminatus Pharma, Inc. is bearish. Key indicators driving this stance include bearish signals from the MACD on both weekly and monthly time frames, bearish Bollinger Bands, and bearish moving averages on the daily chart. Additionally, the KST and Dow Theory also indicate bearish trends on both weekly and monthly levels. The OBV shows a mildly bearish stance on the weekly but no trend on the monthly. The stock has significantly underperformed against the S&P 500, with a year-to-date return of -88.5% compared to the S&P 500's 12.22%....
Read More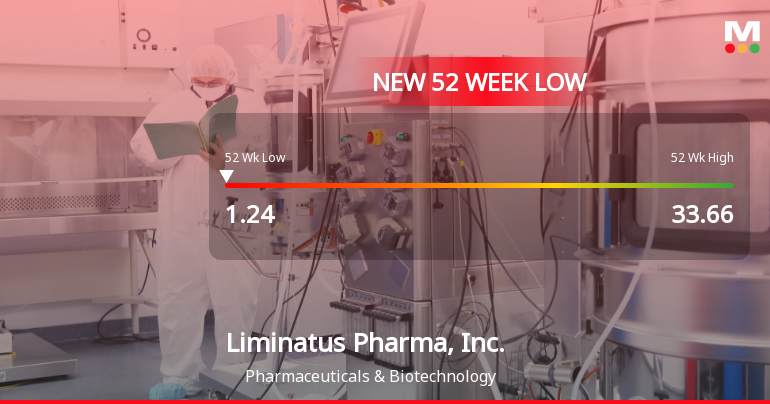
Liminatus Pharma Stock Plummets to New 52-Week Low of $1.24
2025-09-19 13:19:50Liminatus Pharma, Inc. has reached a new 52-week low, reflecting its challenging performance compared to the S&P 500. With a market cap of USD 63 million, the company faces significant hurdles, including a negative price-to-book ratio and a troubling return on equity, highlighting the volatility in the biotechnology sector.
Read More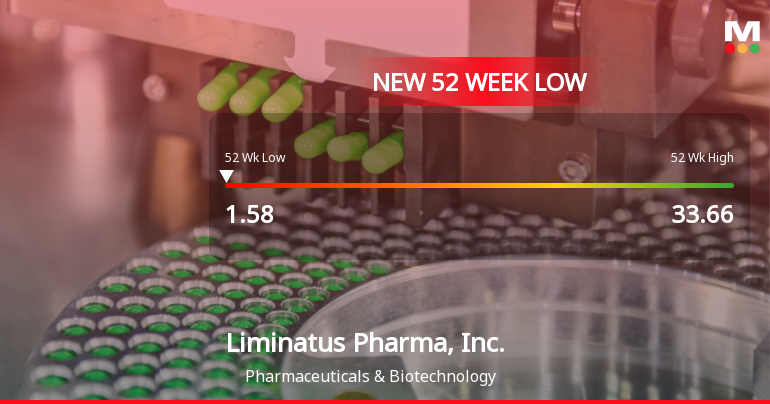
Liminatus Pharma Stock Plummets to New 52-Week Low of $1.58
2025-09-18 13:32:04Liminatus Pharma, Inc. has reached a new 52-week low of USD 1.58, contrasting sharply with its previous high of USD 33.66. The company, with a market cap of USD 63 million, faces significant financial challenges, including a negative return on equity and a unique debt-to-equity ratio.
Read More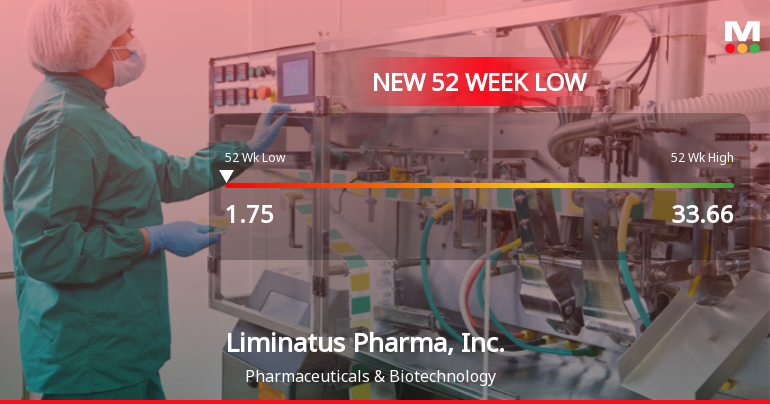
Liminatus Pharma Stock Plummets to New 52-Week Low of $1.75
2025-09-17 15:27:25Liminatus Pharma, Inc. has reached a new 52-week low of USD 1.75, significantly down from its earlier high of USD 33.66. With a market capitalization of approximately USD 63 million, the company faces challenges, including a notably negative return on equity and a unique debt-to-equity ratio.
Read More
Corporate Actions


