

Mahindra Holidays & Resorts India Ltd Surges 7.93% to Day's High of Rs 223.3 — Outperforms Sector by 5.38 Percentage Points
2026-06-09 11:01:21The Sensex edged up a modest 0.08% on 09 Jun 2026, while Mahindra Holidays & Resorts India Ltd surged 7.93%, outperforming its Hotels & Resorts sector by 5.38 percentage points. This sharp single-session gain stands out as a stock-specific event amid a broadly subdued market environment.
Read full news article
Mahindra Holidays & Resorts India Ltd is Rated Strong Sell
2026-06-07 10:10:47Mahindra Holidays & Resorts India Ltd is rated Strong Sell by MarketsMOJO, with this rating last updated on 28 April 2026. However, the analysis and financial metrics presented here reflect the stock's current position as of 08 June 2026, providing investors with an up-to-date view of the company’s performance and outlook.
Read full news article
Mahindra Holidays & Resorts India Ltd is Rated Strong Sell
2026-06-06 10:10:33Mahindra Holidays & Resorts India Ltd is rated Strong Sell by MarketsMOJO. This rating was last updated on 28 Apr 2026, reflecting a reassessment of the stock’s outlook. However, all fundamentals, returns, and financial metrics discussed below are current as of 08 June 2026, providing investors with the latest perspective on the company’s performance and prospects.
Read full news article
Mahindra Holidays & Resorts India Ltd is Rated Strong Sell
2026-06-05 10:10:55Mahindra Holidays & Resorts India Ltd is rated Strong Sell by MarketsMOJO. This rating was last updated on 28 Apr 2026. However, the analysis and financial metrics discussed below reflect the stock’s current position as of 08 June 2026, providing investors with the most up-to-date view of the company’s fundamentals, returns, and market performance.
Read full news article
Mahindra Holidays & Resorts India Ltd Falls to 52-Week Low of Rs 210.65 as Sell-Off Deepens
2026-06-03 10:02:47A sharp decline has pushed Mahindra Holidays & Resorts India Ltd to a fresh 52-week low of Rs 210.65 on 3 June 2026, marking a significant 44.8% drop from its peak of Rs 381.55 within the last year. This downturn comes amid a broader market weakness but is notably more severe than the benchmark Sensex, which itself is hovering near a 52-week low.
Read full news article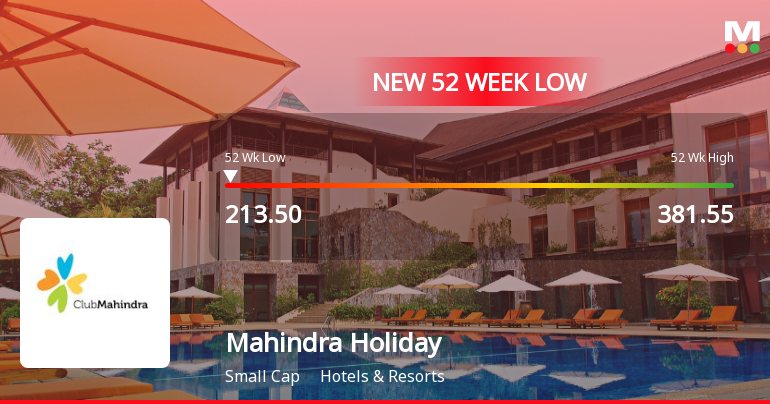
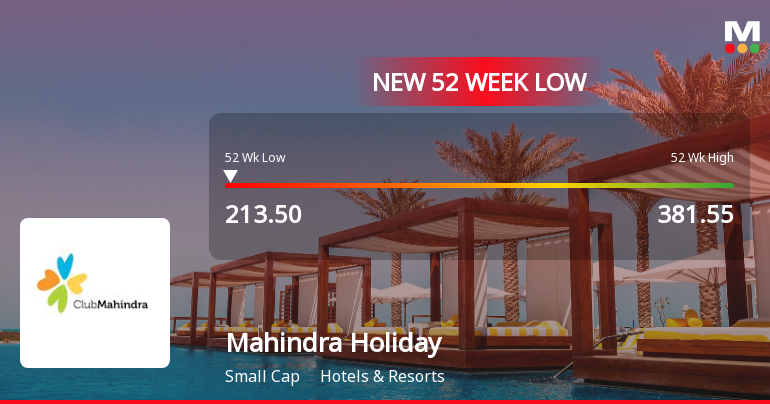
Mahindra Holidays & Resorts India Ltd Falls to 52-Week Low of Rs 213.5 as Sell-Off Deepens
2026-06-02 09:50:35For the fifth consecutive session, Mahindra Holidays & Resorts India Ltd closed lower, hitting a fresh 52-week low of Rs 213.5 on 2 June 2026. This marks a significant 44% decline from its 52-week high of Rs 381.55, underscoring persistent selling pressure despite some pockets of operational growth.
Read full news article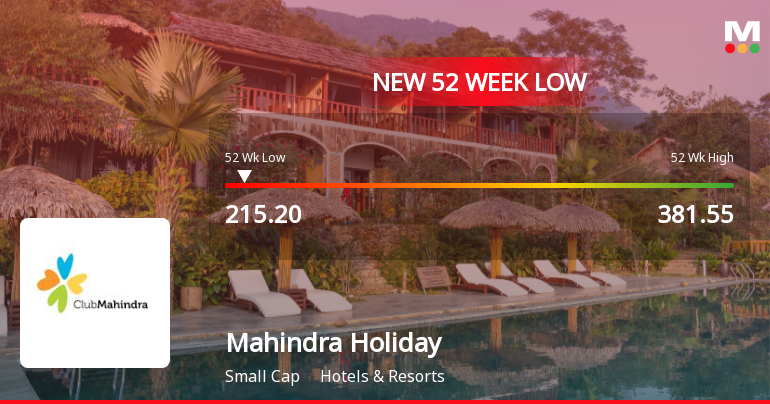
Mahindra Holidays & Resorts India Ltd Falls to 52-Week Low of Rs 215.2 as Sell-Off Deepens
2026-05-29 15:37:15For the third consecutive session, Mahindra Holidays & Resorts India Ltd has declined, culminating in a fresh 52-week low of Rs 215.2 on 29 May 2026. This marks a significant 43.6% drop from its 52-week high of Rs 381.55, underscoring persistent selling pressure despite some intraday recovery attempts.
Read full news article
Mahindra Holidays & Resorts India Ltd is Rated Strong Sell
2026-05-25 10:10:56Mahindra Holidays & Resorts India Ltd is rated Strong Sell by MarketsMOJO. This rating was last updated on 28 Apr 2026, reflecting a reassessment of the stock’s outlook. However, the analysis and financial metrics presented here are based on the company’s current position as of 25 May 2026, providing investors with the latest insights into its performance and prospects.
Read full news articleClarification On Increase In Volume
10-Jun-2026 | Source : BSEPlease refer the attached file.
Clarification sought from Mahindra Holidays & Resorts India Ltd
10-Jun-2026 | Source : BSEThe Exchange has sought clarification from Mahindra Holidays & Resorts India Ltd on June 10 2026 with reference to Movement in Volume.
The reply is awaited.
Announcement under Regulation 30 (LODR)-Newspaper Publication
09-Jun-2026 | Source : BSEPlease refer attached file
Corporate Actions

No Upcoming Board Meetings

Mahindra Holidays & Resorts India Ltd has declared 40% dividend, ex-date: 25 Jul 18

No Splits history available

Mahindra Holidays & Resorts India Ltd has announced 1:2 bonus issue, ex-date: 08 Sep 21

No Rights history available


