Key Events This Week
Jul 13: Technical momentum shifts amid mixed market signals
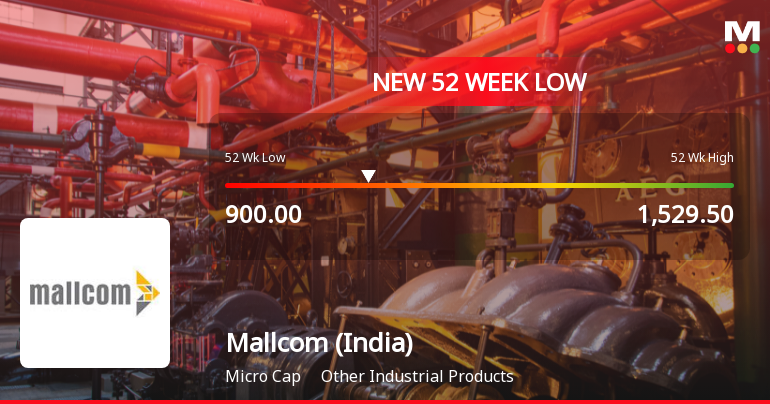
Jul 15: Stock hits 52-week low of Rs.900 amid continued underperformance
Jul 17: Week closes at Rs.1,053.70 (+0.76%)
Week Open
Rs.1,045.75
Week Close
Rs.1,053.70
+0.76%
Read full news article