

Mallcom (India) Ltd is Rated Sell
2026-06-09 10:11:04Mallcom (India) Ltd is rated 'Sell' by MarketsMOJO, with this rating last updated on 12 January 2026. However, the analysis and financial metrics discussed here reflect the stock's current position as of 09 June 2026, providing investors with an up-to-date view of the company’s fundamentals, returns, and technical outlook.
Read full news article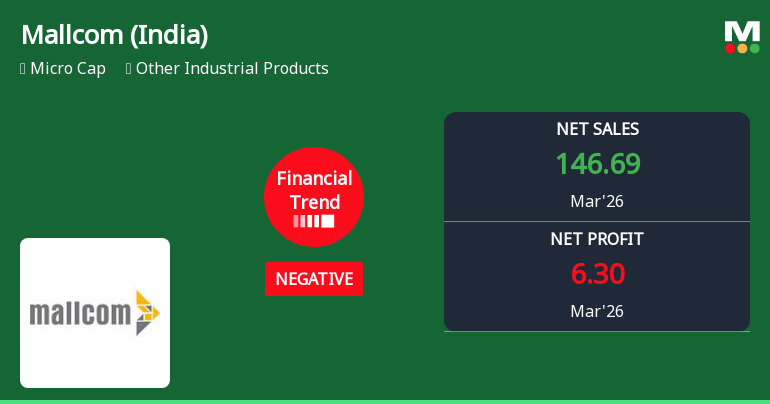
Mallcom (India) Ltd Reports Negative Financial Trend Amid Highest Quarterly Sales
2026-06-01 08:00:27Mallcom (India) Ltd, a micro-cap player in the Other Industrial Products sector, reported its quarterly results for March 2026, revealing a complex financial picture. Despite achieving its highest-ever quarterly net sales at ₹146.69 crores, the company’s profitability metrics deteriorated sharply, signalling a shift from a previously flat to a negative financial trend. This development has led to a downgrade in its Mojo Grade from Strong Sell to Sell, reflecting growing investor concerns amid a challenging market environment.
Read full news articleAre Mallcom (India) Ltd latest results good or bad?
2026-05-30 19:49:46Mallcom (India) Ltd's latest financial results for the quarter ending March 2026 present a complex picture of operational performance. The company reported net sales of ₹146.69 crores, reflecting a year-on-year growth of 6.63%, which indicates a continuation of revenue momentum. This growth is notable, especially as it marks the highest quarterly sales figure on record for the company. However, this positive revenue trend contrasts sharply with a significant decline in profitability. Net profit for the same quarter plummeted to ₹6.30 crores, representing a substantial year-on-year decrease of 78.84%. This sharp decline in profit is attributed to margin compression and a notable drop in other income, which fell from ₹25.54 crores in the previous year to just ₹0.30 crores in the latest quarter. The profit after tax (PAT) margin also contracted to 4.29%, down from 21.64% a year earlier, highlighting the chall...
Read full news article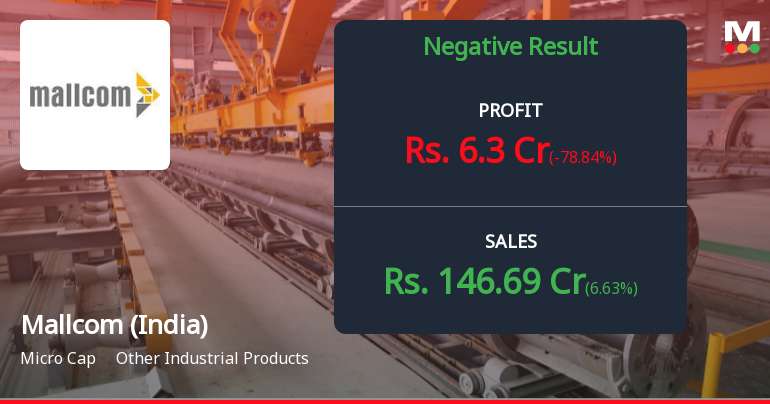
Mallcom (India) Q4 FY26: Profit Plunge Triggers Sharp Selloff Despite Revenue Growth
2026-05-29 20:48:45Mallcom (India) Ltd., a Kolkata-based manufacturer and exporter of personal protective equipment, reported a dramatic 78.84% year-on-year decline in net profit for Q4 FY26, sending shares tumbling 8.34% in Friday's trading session. The ₹633.00 crore market capitalisation company posted net profit of just ₹6.30 crores for the March 2026 quarter, down sharply from ₹29.77 crores in the year-ago period, despite achieving its highest-ever quarterly revenue of ₹146.69 crores.
Read full news article
Mallcom (India) Ltd is Rated Sell
2026-05-28 10:10:30Mallcom (India) Ltd is rated Sell by MarketsMOJO, with this rating last updated on 12 Jan 2026. However, the analysis and financial metrics discussed here reflect the stock’s current position as of 28 May 2026, providing investors with the latest insights into the company’s performance and outlook.
Read full news article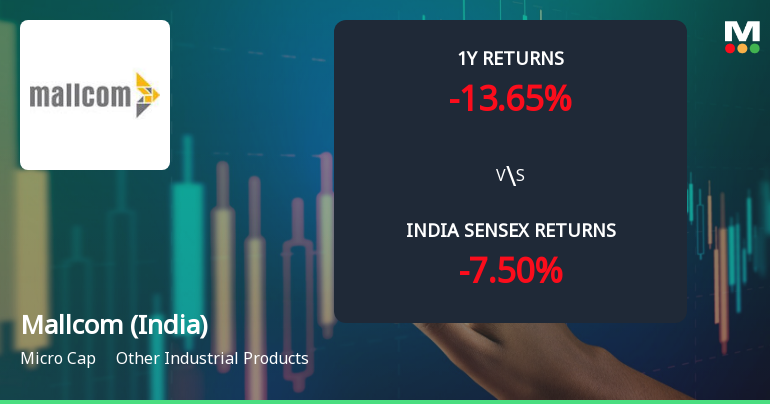
Mallcom (India) Ltd Technical Momentum Shifts Amid Bearish Signals
2026-05-27 08:02:03Mallcom (India) Ltd, a micro-cap player in the Other Industrial Products sector, has experienced a notable shift in its technical momentum, moving from a mildly bearish stance to a more pronounced bearish trend. Recent technical indicators, including MACD, RSI, Bollinger Bands, and moving averages, signal increasing downside pressure, coinciding with a 4.13% drop in the stock price on 27 May 2026. This article analyses the evolving technical landscape and what it means for investors amid broader market comparisons.
Read full news article
Mallcom (India) Ltd Technical Momentum Shifts Amid Mixed Market Signals
2026-05-26 08:02:38Mallcom (India) Ltd, a micro-cap player in the Other Industrial Products sector, has experienced a subtle shift in its technical momentum, moving from a bearish stance to a mildly bearish outlook. Despite a modest day gain of 1.86%, the stock’s technical indicators present a complex picture, reflecting both cautious optimism and lingering bearish pressures as it navigates a challenging market environment.
Read full news articleWhen is the next results date for Mallcom (India) Ltd?
2026-05-22 23:19:55The next results date for Mallcom (India) Ltd is scheduled for 28 May 2026....
Read full news article
Mallcom (India) Ltd is Rated Sell by MarketsMOJO
2026-05-17 10:10:15Mallcom (India) Ltd is rated 'Sell' by MarketsMOJO, with this rating last updated on 12 Jan 2026. However, the analysis and financial metrics discussed here reflect the stock's current position as of 17 May 2026, providing investors with an up-to-date view of its fundamentals, returns, and market performance.
Read full news articleAnnouncement under Regulation 30 (LODR)-Earnings Call Transcript
01-Jun-2026 | Source : BSETranscript of Q4 FY26 Earnings Conference Call.
Compliances-Reg.24(A)-Annual Secretarial Compliance
30-May-2026 | Source : BSEAnnual Secretarial Compliance Report for the year ended March 31 2026.
Announcement under Regulation 30 (LODR)-Analyst / Investor Meet - Outcome
29-May-2026 | Source : BSEAudio Recording of Q4 FY26 Earnings Conference Call
Corporate Actions

No Upcoming Board Meetings

Mallcom (India) Ltd has declared 30% dividend, ex-date: 22 Aug 25

No Splits history available

No Bonus history available

No Rights history available


