
Key Events This Week
1 Jun: Stock opens at Rs.36.00, declines 1.23% amid broad market weakness
2 Jun: Golden Cross formation signals potential bullish breakout
3 Jun: Upgrade to Buy rating by MarketsMOJO on strong financial and technical signals
4 Jun: Price rebounds 2.75% on increased volume
5 Jun: Week closes lower at Rs.35.09, down 2.26% on final trading day
Manaksia Aluminium Company Ltd: Valuation Shift Enhances Price Attractiveness Amid Strong Market Returns
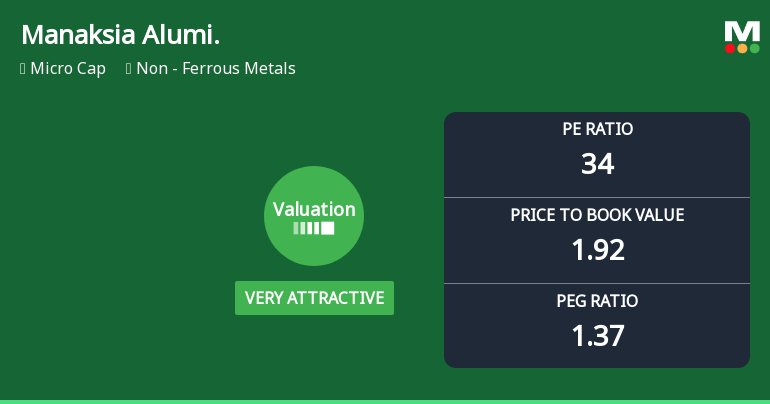
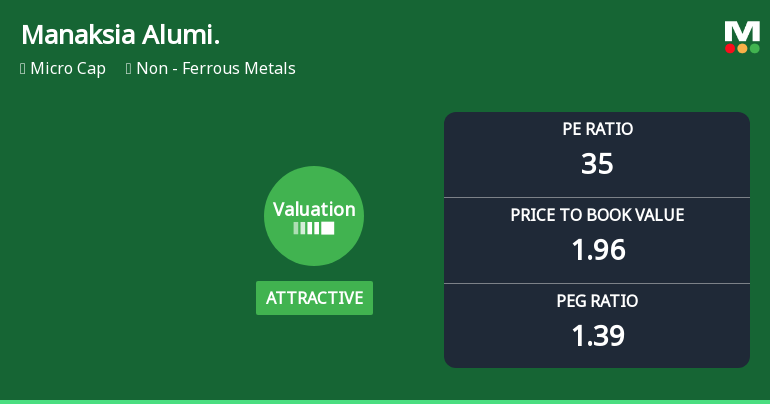
2026-06-10 08:01:08Manaksia Aluminium Company Ltd has witnessed a notable shift in its valuation parameters, moving from a very attractive to an attractive rating, reflecting a growing investor appetite amid improving fundamentals and robust price performance. The stock’s recent surge of 17.71% in a single day underscores renewed market confidence, supported by a strong year-to-date return of 39.91%, significantly outperforming the Sensex’s negative 13.26% over the same period.
Read full news article
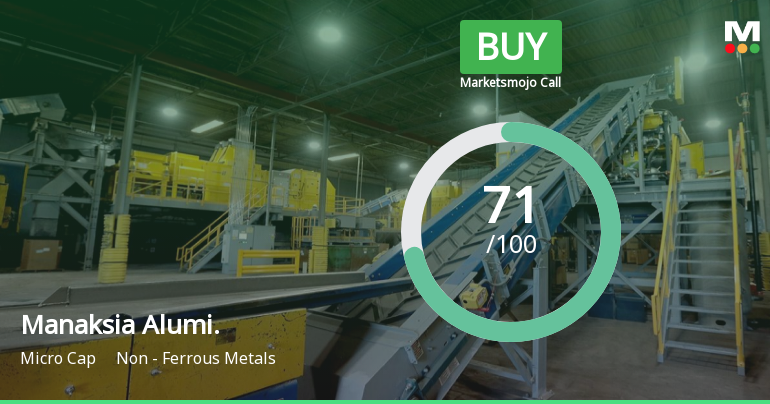
Manaksia Aluminium Company Ltd Upgraded to Buy on Strong Financial and Technical Signals
2026-06-03 08:16:57Manaksia Aluminium Company Ltd has seen its investment rating upgraded from Hold to Buy, reflecting significant improvements across technical indicators, valuation metrics, financial trends, and overall quality. This upgrade, effective from 2 June 2026, underscores the company’s robust operational performance and favourable market positioning within the non-ferrous metals sector.
Read full news article
Golden Cross Forms in Manaksia Aluminium Company Ltd — On a Day the Stock Fell 1.5%. What the Mixed Signals Mean
2026-06-02 18:00:48The 50-day moving average has crossed above the 200-day moving average for Manaksia Aluminium Company Ltd, signalling a golden cross on 2 Jun 2026. Yet, the stock declined 1.5% on the day the cross formed, and while weekly and monthly MACD indicators are bullish, other technical signals and recent price action present a more nuanced picture that demands closer examination.
Read full news article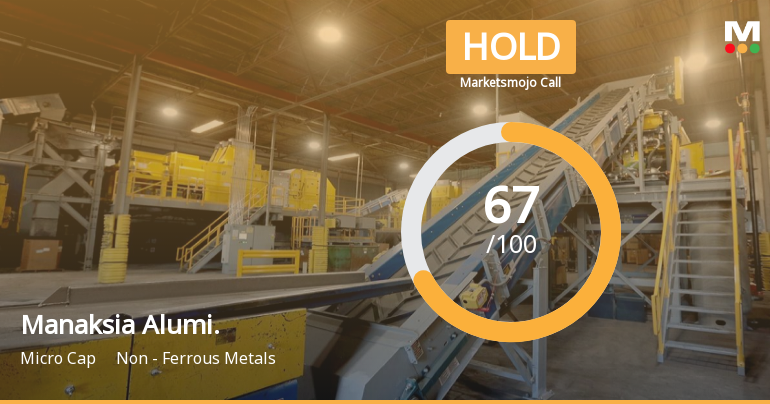
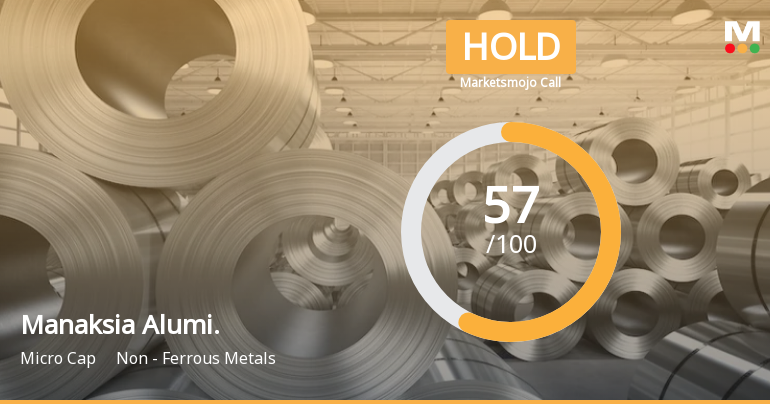
Manaksia Aluminium Company Ltd is Rated Hold by MarketsMOJO
2026-05-27 10:10:04Manaksia Aluminium Company Ltd is rated 'Hold' by MarketsMOJO, with this rating last updated on 07 May 2026. However, the analysis and financial metrics discussed here reflect the stock's current position as of 27 May 2026, providing investors with an up-to-date view of its performance and prospects.
Read full news articleManaksia Aluminium Falls 6.14% Amid Volatile Week with Sharp Rebound
2026-05-16 16:00:04
Key Events This Week
11 May: Valuation upgraded to Very Attractive amid strong market returns
13 May: Stock hits upper circuit with a 9.98% surge on robust buying momentum
15 May: Week closes at ₹34.55, down 6.14% from previous Friday
Manaksia Aluminium Company Ltd is Rated Hold
2026-05-16 10:10:27Manaksia Aluminium Company Ltd is rated 'Hold' by MarketsMOJO, with this rating last updated on 07 May 2026. However, the analysis and financial metrics discussed here reflect the stock's current position as of 16 May 2026, providing investors with the latest insights into its performance and outlook.
Read full news article


