
MAXIMUS, Inc. Experiences Valuation Adjustment Amid Competitive Market Landscape
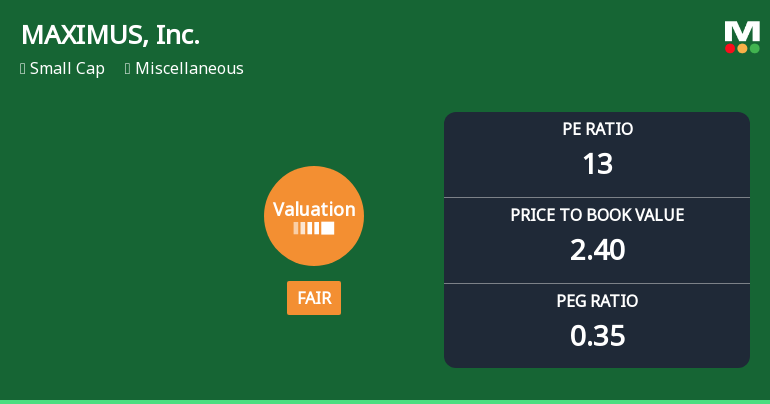
2025-11-10 15:48:19MAXIMUS, Inc. has recently adjusted its valuation, with its stock price at $84.08. Over the past year, it has seen a return of -6.41%, compared to the S&P 500's 12.65%. Key metrics include a P/E ratio of 13 and a return on equity of 18.06%.
Read full news articleIs MAXIMUS, Inc. technically bullish or bearish?
2025-10-28 11:39:37As of 24 October 2025, the technical trend for MAXIMUS, Inc. has changed from bullish to mildly bullish. The weekly MACD is bullish, and the Bollinger Bands indicate a bullish stance, while the daily moving averages are mildly bullish. However, the KST shows a bearish monthly trend, and the Dow Theory presents a mildly bearish weekly perspective. The overall technical stance is mildly bullish, driven by the positive weekly MACD and Bollinger Bands. In terms of performance, MAXIMUS has outperformed the S&P 500 over the past week with a return of 2.98% compared to the S&P 500's 1.92%, but it has lagged behind over the longer periods, particularly in the 3-year and 5-year returns....
Read full news articleIs MAXIMUS, Inc. technically bullish or bearish?
2025-10-27 11:50:43As of 24 October 2025, the technical trend for MAXIMUS, Inc. has changed from bullish to mildly bullish. The weekly MACD is bullish, supporting a positive short-term outlook, while the monthly MACD is also bullish, indicating a stronger long-term trend. The Bollinger Bands are bullish on a weekly basis and mildly bullish monthly, suggesting potential upward price movement. However, the KST shows a bearish monthly signal, and the Dow Theory indicates a mildly bearish stance on the weekly timeframe, which tempers the overall bullish sentiment. In terms of returns, MAXIMUS has outperformed the S&P 500 over the past week with a return of 2.98% compared to 1.92%, but it has lagged behind the benchmark over the longer periods, particularly in the 3-year and 5-year comparisons. Overall, the current technical stance is mildly bullish, driven by the positive MACD and Bollinger Bands, despite some mixed signals fro...
Read full news articleIs MAXIMUS, Inc. technically bullish or bearish?
2025-10-26 11:25:24As of 24 October 2025, the technical trend for MAXIMUS, Inc. has changed from bullish to mildly bullish. The weekly MACD is bullish, and the monthly MACD is also bullish, supporting a positive outlook. The Bollinger Bands indicate a bullish stance on the weekly and a mildly bullish stance on the monthly. However, the KST shows a bearish monthly trend, and the Dow Theory presents a mildly bearish weekly view while being mildly bullish monthly. The daily moving averages are mildly bullish, and the OBV is bullish monthly but mildly bearish weekly. In terms of performance, MAXIMUS has outperformed the S&P 500 over the past week with a return of 2.98% compared to 1.92%, but it has underperformed over the past month and year. Overall, the current technical stance is mildly bullish, driven primarily by the bullish MACD and Bollinger Bands, despite some mixed signals from other indicators....
Read full news article
Corporate Actions


