
Key Events This Week
27 Jul: Stock opens at Rs.61.77, up 0.39% amid positive market sentiment
28 Jul: Stock declines 1.96% to Rs.60.56 following downgrade announcement
29 Jul: Downgrade to Strong Sell and technical momentum shift reported
31 Jul: Stock rebounds 4.14% to close at Rs.62.64, highest close of the week
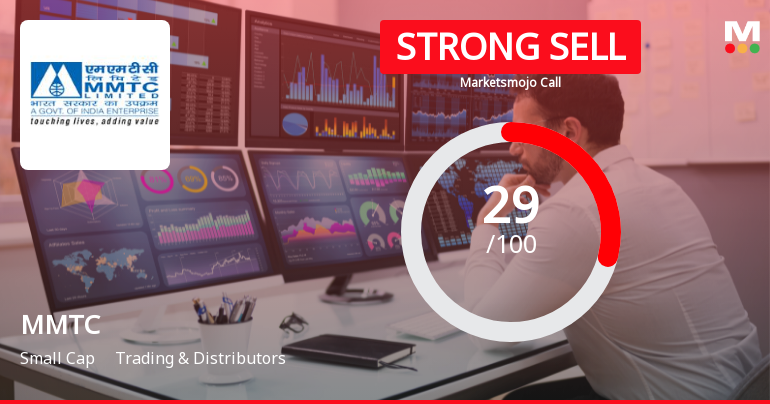
MMTC Ltd Downgraded to Strong Sell Amid Weak Fundamentals and Technical Setbacks
2026-07-29 08:28:53MMTC Ltd, a key player in the Trading & Distributors sector, has seen its investment rating downgraded from Sell to Strong Sell as of 28 July 2026. This revision reflects a deterioration in technical indicators alongside persistent financial weaknesses, despite some positive quarterly results. Investors should carefully consider the multi-faceted factors influencing this change before making portfolio decisions.
Read full news article
MMTC Ltd Technical Momentum Shifts Amid Mixed Market Signals
2026-07-29 08:02:27MMTC Ltd has experienced a notable shift in its technical momentum, with key indicators signalling a transition from a mildly bullish stance to a sideways trend. Despite a recent downgrade to a Strong Sell rating, the stock’s mixed technical signals and price action warrant a detailed analysis for investors navigating the Trading & Distributors sector.
Read full news article
MMTC Ltd is Rated Sell by MarketsMOJO
2026-07-24 10:10:39MMTC Ltd is rated 'Sell' by MarketsMOJO, with this rating last updated on 09 June 2026. However, the analysis and financial metrics discussed here reflect the stock's current position as of 24 July 2026, providing investors with the latest insights into the company’s performance and outlook.
Read full news article
MMTC Ltd is Rated Sell by MarketsMOJO
2026-07-13 10:10:39MMTC Ltd is rated 'Sell' by MarketsMOJO, with this rating last updated on 09 June 2026. However, the analysis and financial metrics discussed here reflect the stock's current position as of 13 July 2026, providing investors with an up-to-date view of the company’s fundamentals, valuation, financial trend, and technical outlook.
Read full news article
MMTC Ltd Technical Momentum Shifts Amid Mixed Market Signals
2026-07-06 08:02:08MMTC Ltd, a small-cap player in the Trading & Distributors sector, has experienced a nuanced shift in its technical momentum, reflecting a complex interplay of bullish and bearish signals across multiple timeframes. Despite a modest decline of 1.02% on 6 July 2026, the stock’s technical indicators reveal a transition from a previously strong sell rating to a sell grade, signalling a cautious but improving outlook for investors.
Read full news article
MMTC Ltd is Rated Sell by MarketsMOJO
2026-07-02 10:10:04MMTC Ltd is rated 'Sell' by MarketsMOJO, with this rating last updated on 09 June 2026. However, the analysis and financial metrics discussed below reflect the stock's current position as of 02 July 2026, providing investors with the latest insights into the company’s performance and outlook.
Read full news article
MMTC Ltd Technical Momentum Shifts Signal Bullish Outlook Amid Mixed Market Returns
2026-07-01 08:02:50MMTC Ltd has exhibited a notable shift in its technical momentum, moving from a mildly bullish stance to a more confident bullish trend. This change is underscored by a combination of technical indicators including MACD, RSI, moving averages, and Bollinger Bands, which collectively suggest improving price momentum despite some mixed signals on longer-term charts.
Read full news article
MMTC Ltd Technical Momentum Shifts Amid Mixed Market Signals
2026-06-30 08:04:50MMTC Ltd, a small-cap player in the Trading & Distributors sector, has experienced a nuanced shift in its technical momentum, reflecting a complex interplay of bullish and bearish signals across multiple timeframes. Despite a recent downgrade in its Mojo Grade to Sell from Strong Sell, the stock’s technical indicators reveal a cautiously optimistic outlook amid ongoing market volatility.
Read full news article


