Key Events This Week
20 Jul: Technical momentum shifts signal bullish outlook
22 Jul: New 52-week and all-time high at Rs.422.25
23 Jul: Further 52-week high at Rs.425.6 and all-time high close at Rs.421.75
24 Jul: Week closes at Rs.392.20 (-2.30% on day)

Broad-Based Technical Strength Lifts Modis Navnirman Ltd to 52-Week High of Rs 425.6
2026-07-23 10:46:26With a decisive surge to Rs 425.6 on 23 Jul 2026, Modis Navnirman Ltd has reached a fresh 52-week high, marking a remarkable 53.5% gain over the past year. This rally is underpinned by a strong alignment of technical indicators and sustained price momentum, setting the stock apart in the Realty sector despite a broadly subdued market backdrop.
Read full news article
Modis Navnirman Ltd Valuation Shifts Signal Heightened Price Attractiveness
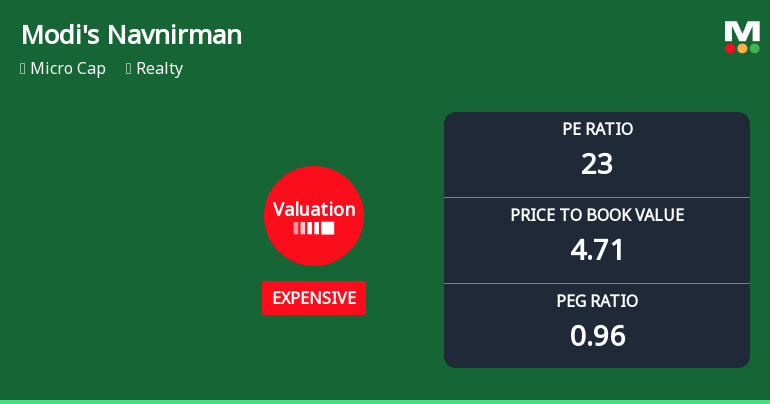
2026-07-23 08:02:27Modis Navnirman Ltd, a micro-cap player in the Realty sector, has seen a notable shift in its valuation parameters, moving from an expensive to a very expensive rating. This change, coupled with strong recent price momentum and robust returns relative to the Sensex, invites a closer examination of its price attractiveness and investment appeal.
Read full news article
Broad-Based Technical Strength Lifts Modis Navnirman Ltd to 52-Week High of Rs 422.25
2026-07-22 09:56:46With a decisive intraday surge to Rs 422.25 on 22 Jul 2026, Modis Navnirman Ltd has reached a fresh 52-week high, marking a 48.18% gain over the past year and significantly outperforming the Sensex, which declined by 6.45% in the same period. This milestone reflects a strong confluence of technical momentum indicators that have propelled the stock despite a broadly negative market backdrop.
Read full news article
Modis Navnirman Ltd Technical Momentum Shifts Signal Bullish Outlook
2026-07-20 08:03:56Modis Navnirman Ltd, a micro-cap player in the Realty sector, has witnessed a notable shift in its technical momentum, moving from a mildly bullish stance to a more confident bullish trend. This transition is underscored by a combination of moving averages, Bollinger Bands, and other technical indicators, suggesting a potential uptrend in the stock price amid mixed signals from momentum oscillators.
Read full news article