
Key Events This Week
May 20: Q4 FY26 results reveal persistent operating losses despite revenue growth
May 21: Strong quarterly upswing reported amid mixed long-term returns
May 22: Week closes at Rs.98.58, up 5.01% for the week
Jun 24, 04:01 PM
BSE+NSE Vol: 47
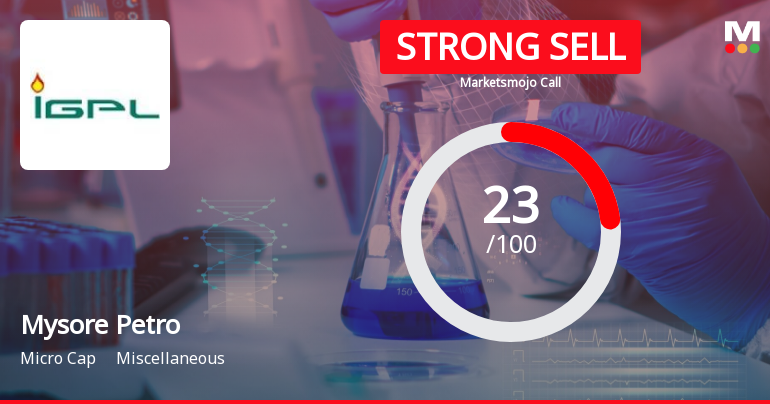
Mysore Petro Chemicals Ltd is rated Strong Sell by MarketsMOJO. This rating was last updated on 21 Nov 2024, reflecting a shift from the previous 'Sell' grade. However, the analysis and financial metrics discussed below represent the stock's current position as of 17 June 2026, providing investors with an up-to-date view of the company’s fundamentals, valuation, financial trends, and technical outlook.
Read full news article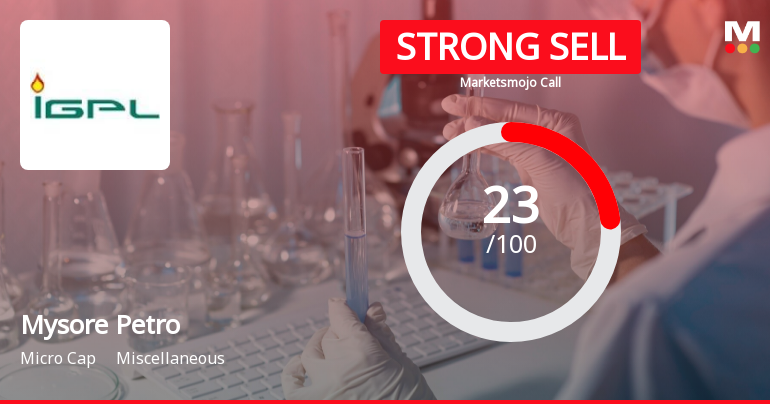
Mysore Petro Chemicals Ltd is rated Strong Sell by MarketsMOJO, with this rating last updated on 21 Nov 2024. However, the analysis and financial metrics discussed here reflect the stock’s current position as of 29 May 2026, providing investors with an up-to-date view of the company’s performance and outlook.
Read full news article
May 20: Q4 FY26 results reveal persistent operating losses despite revenue growth
May 21: Strong quarterly upswing reported amid mixed long-term returns
May 22: Week closes at Rs.98.58, up 5.01% for the week
Mysore Petro Chemicals Ltd reported significant net sales growth of 190.19% year-on-year in Q4 FY26, reaching ₹21.59 crores, marking the highest quarterly revenue in recent periods. However, this topline growth is contrasted by persistent operational challenges, as the company recorded an operating loss of ₹-2.35 crores, resulting in an operating margin of -10.88%. This indicates ongoing difficulties in converting sales into operational profitability. For the full fiscal year FY26, net sales rose to ₹52.22 crores, a notable increase from ₹33.00 crores in FY25, reflecting a growth rate of 58.24%. Despite this revenue growth, the consolidated net profit for the latest six months fell to ₹1.11 crores, representing a substantial decline of 87.09% compared to the previous half-year. This divergence between revenue growth and profitability highlights significant operational inefficiencies that require management...
Read full news article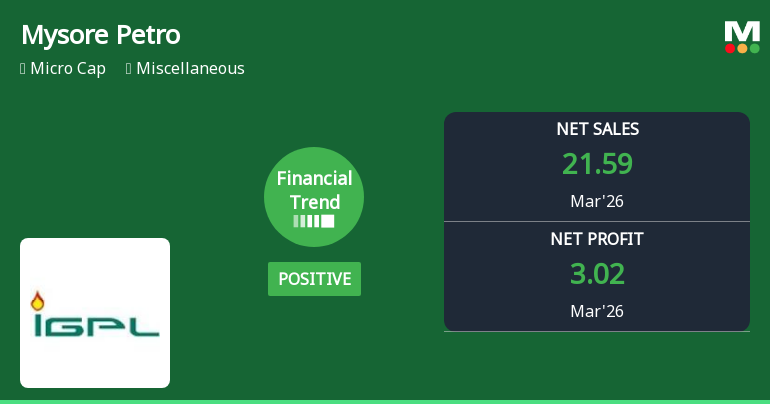
Mysore Petro Chemicals Ltd has demonstrated a notable improvement in its financial performance for the quarter ended March 2026, shifting from a flat to a positive financial trend. Despite this quarterly upswing, the company’s longer-term returns remain subdued compared to benchmark indices, reflecting a complex investment outlook for shareholders.
Read full news article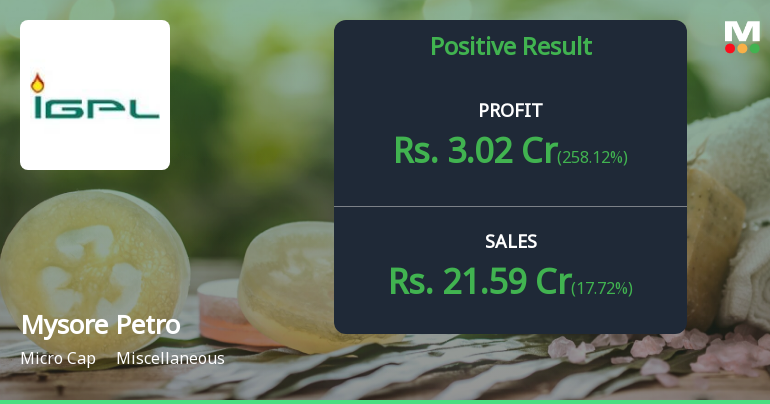
Mysore Petro Chemicals Ltd., a Bangalore-based petrochemical trading company with a market capitalisation of ₹62.00 crores, reported consolidated net profit of ₹3.02 crores for Q4 FY26, marking a dramatic turnaround from a loss of ₹1.91 crores in the preceding quarter. However, the headline figure masks persistent operational challenges that continue to plague the micro-cap firm. The stock traded at ₹96.78 on May 20, 2026, down 23.68% over the past year and 26.07% below its 52-week high of ₹130.90.
Read full news article
Mysore Petro Chemicals Ltd is rated Strong Sell by MarketsMOJO. This rating was last updated on 21 Nov 2024, reflecting a shift from the previous 'Sell' grade. However, the analysis and financial metrics discussed here represent the stock's current position as of 18 May 2026, providing investors with an up-to-date view of the company’s performance and outlook.
Read full news articleThe next results date for Mysore Petro Chemicals Ltd is scheduled for 20 May 2026....
Read full news article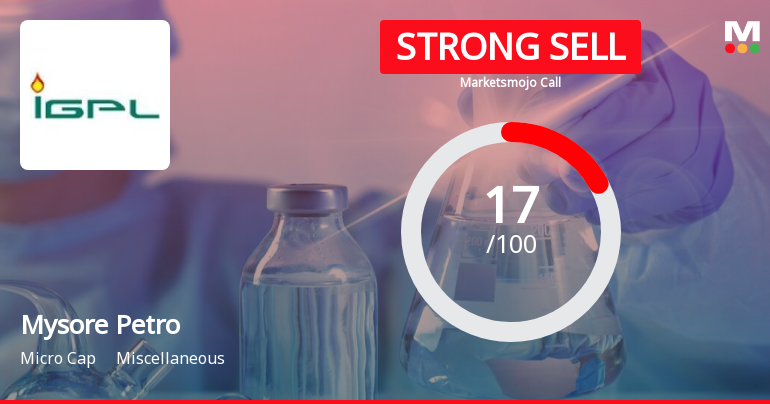
Mysore Petro Chemicals Ltd is rated Strong Sell by MarketsMOJO, with this rating last updated on 21 Nov 2024. However, the analysis and financial metrics discussed here reflect the company’s current position as of 06 May 2026, providing investors with an up-to-date view of the stock’s fundamentals, returns, and technical outlook.
Read full news articleCopy of Newspaper Advertisement for transfer of equity shares of the Company to Investor Education and Protection Fund (IEPF) Authority
Annual Secretarial Compliance under Regulation 24(A).
We enclosed herewith copies of newspaper advertisement published today in Financial Express (English) Bangalore Edition and Samyukta Karnataka (Kannada) Bangalore Edition in respect of the audited financial results for the quarter and year ended 31st March 2026.

No Upcoming Board Meetings

Mysore Petro Chemicals Ltd has declared 20% dividend, ex-date: 07 Aug 25

No Splits history available

No Bonus history available

No Rights history available


