


Key Events This Week
29 Jun: Intraday low amid price pressure and heavy value turnover
30 Jun: Robust trading activity with outperformance and strong buy rating
1 Jul to 3 Jul: Gradual price decline despite Sensex gains
3 Jul: Week closes at Rs.4,425.25 (-0.70%)

Netweb Technologies India Ltd is Rated Strong Buy
2026-06-30 10:10:55Netweb Technologies India Ltd is rated Strong Buy by MarketsMOJO, with this rating last updated on 11 May 2026. However, the analysis and financial metrics presented here reflect the stock’s current position as of 30 June 2026, providing investors with the most up-to-date insight into the company’s performance and outlook.
Read full news article
Netweb Technologies India Ltd Sees Robust Trading Activity Amid Strong Buy Rating
2026-06-30 10:00:23Netweb Technologies India Ltd, a prominent player in the Computers - Software & Consulting sector, has witnessed significant trading momentum with one of the highest value turnovers in recent sessions. The stock’s strong performance, coupled with increased institutional participation and a recent upgrade in its Mojo Grade, signals renewed investor confidence in this small-cap technology firm.
Read full news article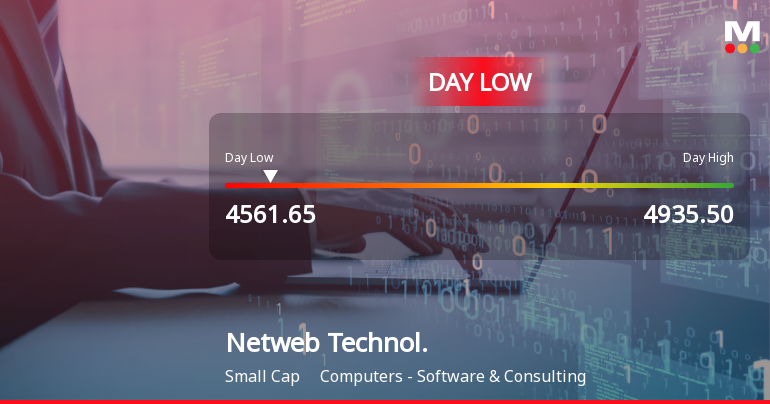
Netweb Technologies India Ltd Hits Intraday Low Amid Price Pressure
2026-06-29 10:08:09Netweb Technologies India Ltd experienced a significant intraday decline on 29 Jun 2026, touching a low of Rs 4,561.65, down 7.74% from the previous close. The stock underperformed its sector and the broader market, reflecting immediate selling pressure and heightened volatility during the trading session.
Read full news article
Netweb Technologies India Ltd Sees Sharp Value Turnover Amid Volatile Trading
2026-06-29 10:00:28Netweb Technologies India Ltd, a small-cap player in the Computers - Software & Consulting sector, emerged as one of the most actively traded stocks by value on 29 June 2026. Despite a sharp intraday decline of 7.41%, the stock attracted significant institutional interest and large order flow, reflecting heightened market attention amid volatile trading conditions.
Read full news article


