Key Events This Week
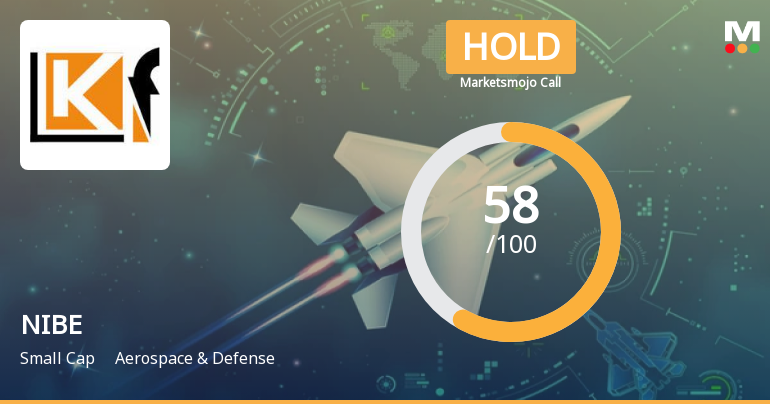
15 Jun: MarketsMOJO upgrades NIBE Ltd to Hold on technical and valuation improvements
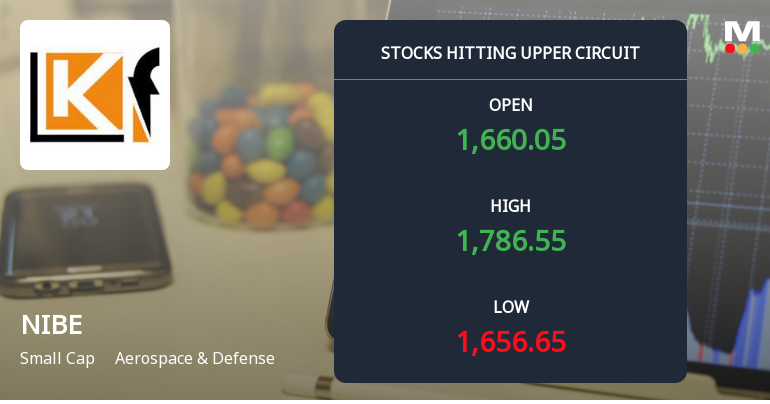
18 Jun: Stock hits upper circuit with 10% surge amid strong buying pressure
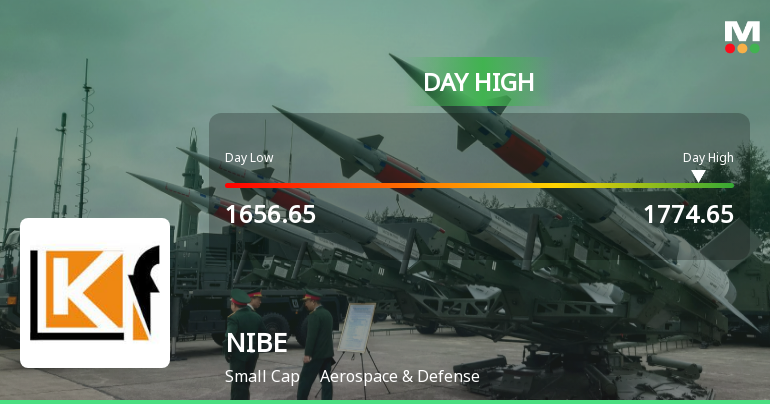
18 Jun: Intraday high of Rs.1,745.75 with 7.75% gain
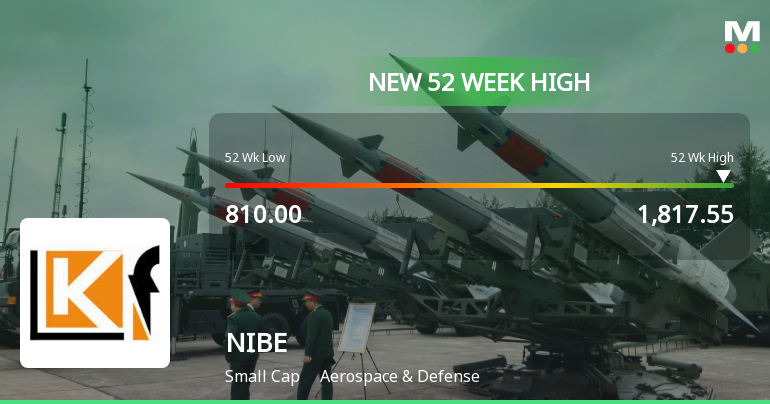
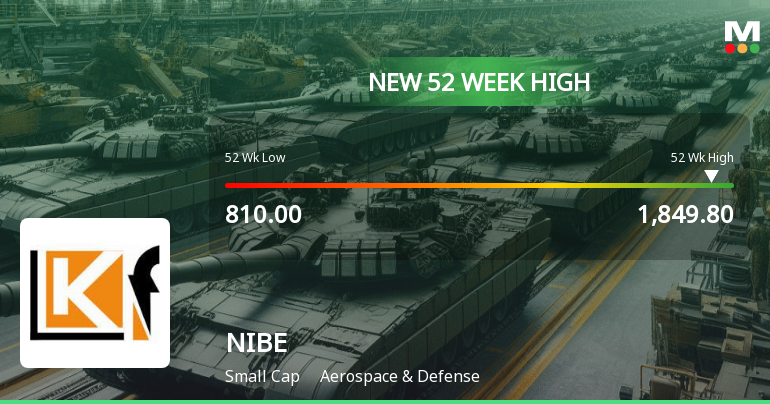
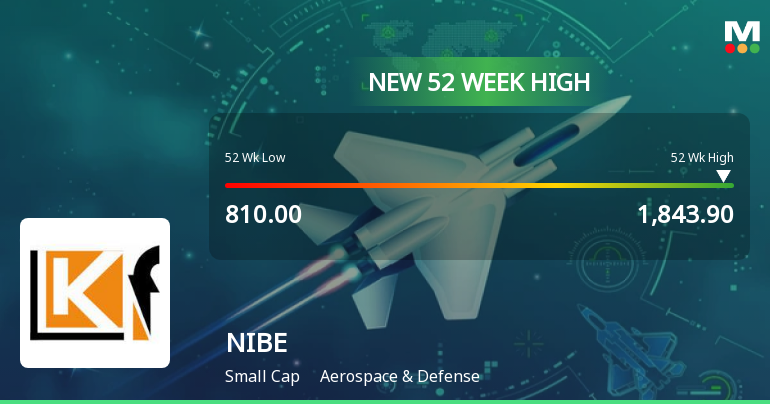
19 Jun: New 52-week high reached at Rs.1,817.55
Week Open
Rs.1,581.60