
Key Events This Week
11 May: Intraday high surge to Rs.89.47 (+10.09%) with exceptional volume
12 May: Valuation concerns arise as P/E ratio hits 119.09, signalling expensive pricing
15 May: Week closes at Rs.79.89, down 1.70% but outperforming Sensex

Niva Bupa Health Insurance Company Ltd is Rated Hold
2026-05-14 10:10:03Niva Bupa Health Insurance Company Ltd is rated 'Hold' by MarketsMOJO, with this rating last updated on 08 May 2026. However, the analysis and financial metrics discussed here reflect the company’s current position as of 14 May 2026, providing investors with an up-to-date perspective on the stock’s fundamentals, valuation, financial trends, and technical outlook.
Read full news article
Niva Bupa Health Insurance Valuation Shifts Signal Price Attractiveness Concerns
2026-05-12 08:01:35Niva Bupa Health Insurance Company Ltd has witnessed a marked shift in its valuation parameters, moving from a risky to a very expensive territory. Despite recent positive price momentum, the company’s elevated price-to-earnings and price-to-book ratios relative to peers and historical averages raise questions about its price attractiveness for investors seeking value in the insurance sector.
Read full news article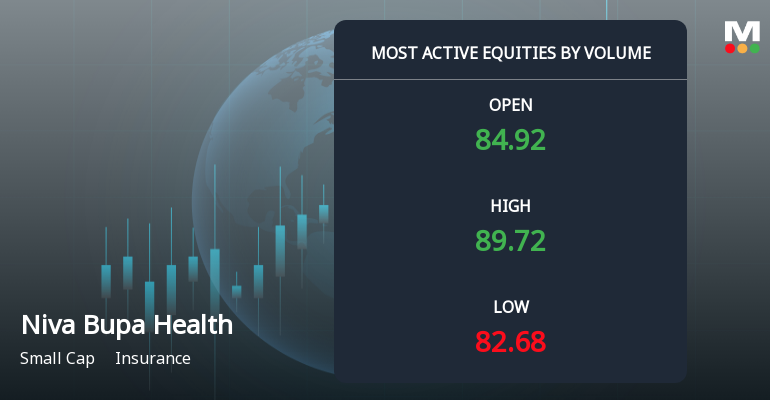
Niva Bupa Health Insurance Sees Exceptional Volume Surge Amidst Strong Price Gains
2026-05-11 10:00:18Niva Bupa Health Insurance Company Ltd has emerged as one of the most actively traded stocks on 11 May 2026, registering a remarkable surge in volume alongside robust price appreciation. The stock outperformed its sector and broader market indices, signalling renewed investor interest and potential accumulation in this small-cap insurance player.
Read full news article
Niva Bupa Health Insurance Company Ltd Surges 8.33% to Day's High of Rs 89.47 — Outperforms Sector by 10.19 Percentage Points
2026-05-11 09:31:32While the Sensex declined by 1.06% on 11 May 2026, Niva Bupa Health Insurance Company Ltd surged 8.33%, marking a striking 10.19 percentage-point outperformance over its sector. The stock’s intraday high of Rs 89.47 and a robust 25.26% intraday volatility underscore a session dominated by stock-specific strength rather than broader market momentum.
Read full news articleAre Niva Bupa Health Insurance Company Ltd latest results good or bad?
2026-05-09 19:18:30Niva Bupa Health Insurance Company Ltd's latest financial results for Q4 FY26 present a complex picture characterized by significant volatility in earnings. The company reported a net profit of ₹345.13 crores, a notable recovery from losses in the previous quarters, and a substantial increase compared to ₹206.08 crores in Q4 FY25. This reflects a year-on-year growth of 67.48%. Additionally, revenue for the quarter reached ₹1,971.95 crores, marking a robust year-on-year growth of 29.10% and a quarter-on-quarter increase of 35.66%. The operating margin improved to 18.52%, up from negative margins in the preceding quarter, indicating a strong turnaround in operational performance. However, this improvement comes against a backdrop of extreme earnings volatility, as the company experienced consecutive losses in the first three quarters of FY26, totaling ₹214.35 crores. This raises concerns about the sustainab...
Read full news article
Niva Bupa Health Insurance Q4 FY26: Stellar Turnaround Masks Underlying Volatility Concerns
2026-05-09 09:54:19Niva Bupa Health Insurance Company Ltd. posted a dramatic quarterly turnaround in Q4 FY26, swinging to a net profit of ₹345.13 crores from a loss of ₹87.64 crores in the preceding quarter, marking a remarkable reversal for the health insurance specialist. The stock, trading at ₹81.27 as of May 08, 2026, has responded positively to the results, gaining 1.52% in the latest session and currently commanding a market capitalisation of ₹14,745.00 crores in the small-cap segment.
Read full news article
Niva Bupa Health Insurance Sees Mildly Bullish Technical Shift Amid Mixed Returns
2026-05-06 08:06:58Niva Bupa Health Insurance Company Ltd has exhibited a subtle shift in its technical momentum, moving from a sideways trend to a mildly bullish stance on weekly charts. Despite a recent downgrade in its Mojo Grade from Strong Sell to Sell, the stock’s technical indicators present a nuanced picture, with mixed signals from MACD, RSI, moving averages, and volume-based metrics. This analysis delves into the evolving price momentum and technical parameters shaping investor sentiment as the stock navigates a challenging insurance sector backdrop.
Read full news article
Niva Bupa Health Insurance Company Ltd is Rated Sell
2026-05-03 10:10:13Niva Bupa Health Insurance Company Ltd is rated 'Sell' by MarketsMOJO, with this rating last updated on 30 Mar 2026. However, the analysis and financial metrics discussed here reflect the stock's current position as of 03 May 2026, providing investors with an up-to-date perspective on the company’s performance and outlook.
Read full news article


