
Key Events This Week
15 Jun: Stock opens at Rs.316.15, Sensex up 1.19%
16 Jun: Technical momentum shifts to bullish; stock closes Rs.317.65 (+0.47%)
17 Jun: Mild pullback with mixed signals; valuation upgraded to attractive
18 Jun: Strong price gain of 4.13%, technical momentum confirmed bullish
19 Jun: Week closes at Rs.321.65, technical momentum remains bullish
NLC India Ltd. Technical Momentum Shifts to Bullish Amid Strong Price Gains
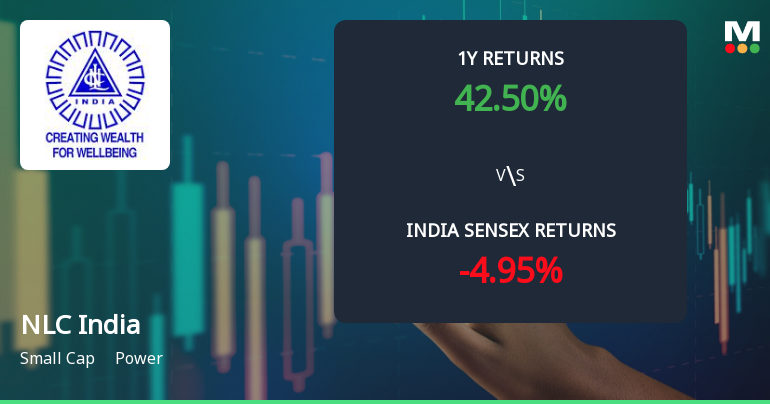
2026-06-19 08:01:38NLC India Ltd., a key player in the power sector, has witnessed a notable shift in its technical momentum, moving from a mildly bullish stance to a more confident bullish trend. This change is underscored by robust price action, with the stock gaining 4.13% on 19 Jun 2026, closing at ₹323.75, up from the previous close of ₹310.90. Technical indicators such as MACD, moving averages, and Bollinger Bands signal strengthening momentum, suggesting renewed investor interest and potential for further upside.
Read full news article
NLC India Ltd. Technical Momentum Shifts Amid Mixed Market Signals
2026-06-17 08:03:25NLC India Ltd., a small-cap player in the power sector, has experienced a nuanced shift in its technical momentum, moving from a bullish to a mildly bullish stance. Despite a recent dip in price, key technical indicators such as MACD and KST maintain bullish signals on weekly and monthly charts, while moving averages and Bollinger Bands suggest a cautious optimism. This article analyses the evolving technical landscape of NLC India Ltd. and its implications for investors amid broader market trends.
Read full news article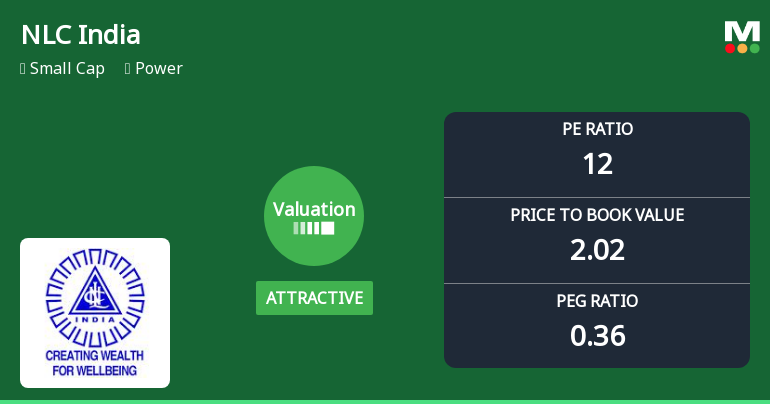
NLC India Ltd: Valuation Shifts Signal Renewed Price Attractiveness Amid Sector Dynamics
2026-06-17 08:00:49NLC India Ltd., a small-cap player in the power sector, has witnessed a notable shift in its valuation parameters, moving from a fair to an attractive rating. This change reflects evolving market perceptions and improved price attractiveness relative to historical averages and peer benchmarks, despite a recent modest decline in share price. Investors are now re-evaluating the stock’s potential amid a backdrop of strong multi-year returns and a more favourable price-to-earnings (P/E) and price-to-book value (P/BV) profile.
Read full news article
NLC India Ltd. Technical Momentum Shifts to Bullish Amid Strong Long-Term Returns
2026-06-16 08:04:07NLC India Ltd., a small-cap player in the power sector, has witnessed a notable shift in its technical momentum, moving from a mildly bullish stance to a more confident bullish trend. This change is supported by a confluence of technical indicators, including MACD, Bollinger Bands, and moving averages, signalling renewed investor interest despite recent short-term price volatility.
Read full news articleNLC India Ltd Falls 6.05%: 5 Key Factors Driving the Weekly Decline
2026-06-13 12:09:59
Key Events This Week
8 June: Stock opens at Rs.335.65, declines 0.25% amid broader market weakness
9 June: Heavy volume trading with price drop to Rs.327.85 despite mojo grade upgrade to Hold
10 June: Exceptional volume and high-value trading continue; price falls further to Rs.309.55
11 June: Technical momentum shifts to mildly bullish despite sharp 5.58% price decline
12 June: Price recovers modestly to Rs.316.15 as Sensex rallies 2.20%
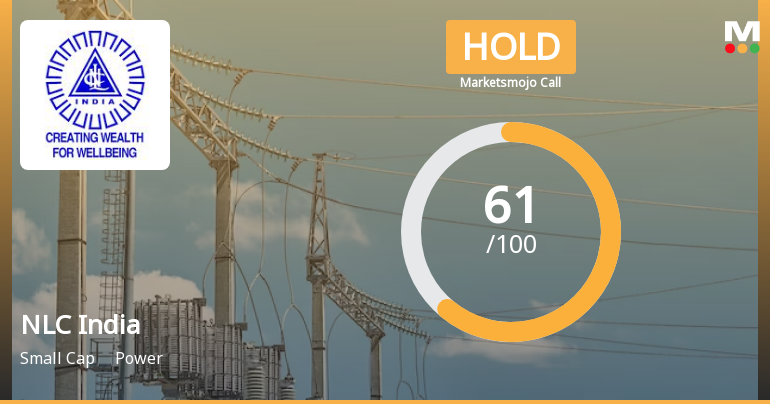
NLC India Ltd. is Rated Hold by MarketsMOJO
2026-06-13 10:10:05NLC India Ltd. is rated 'Hold' by MarketsMOJO, with this rating last updated on 11 February 2026. However, the analysis and financial metrics discussed here reflect the company’s current position as of 13 June 2026, providing investors with an up-to-date view of its fundamentals, returns, and market standing.
Read full news article
NLC India Ltd. Technical Momentum Shifts Amid Mixed Market Signals
2026-06-11 08:03:01NLC India Ltd., a small-cap player in the power sector, has experienced a notable shift in its technical momentum, moving from a bullish to a mildly bullish stance. Despite a recent day decline of 5.58%, the stock’s longer-term indicators suggest a cautiously optimistic outlook, supported by strong returns relative to the Sensex over multiple time frames.
Read full news article
NLC India Ltd: Valuation Shifts Signal Renewed Price Attractiveness Amid Sector Dynamics
2026-06-11 08:00:47NLC India Ltd., a key player in the power sector, has witnessed a notable shift in its valuation parameters, moving from a fair to an attractive rating. This change reflects a recalibration of its price-to-earnings (P/E) and price-to-book value (P/BV) ratios relative to historical averages and peer benchmarks, offering investors a fresh perspective on its price attractiveness despite recent market headwinds.
Read full news article


