


Key Events This Week
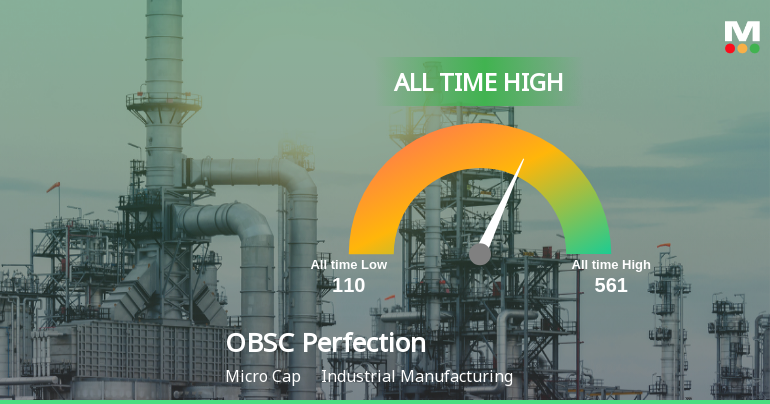
25 May: All-time high reached at Rs.485.9
26 May: Sharp decline of 4.62% amid profit booking
27 May: Strong rebound with 6.29% gain
29 May: Week closes lower at Rs.459.85 (-0.20% for the week)
Week Open
Rs.460.75
Jun 19, 03:30 PM
BSE+NSE Vol: 17600

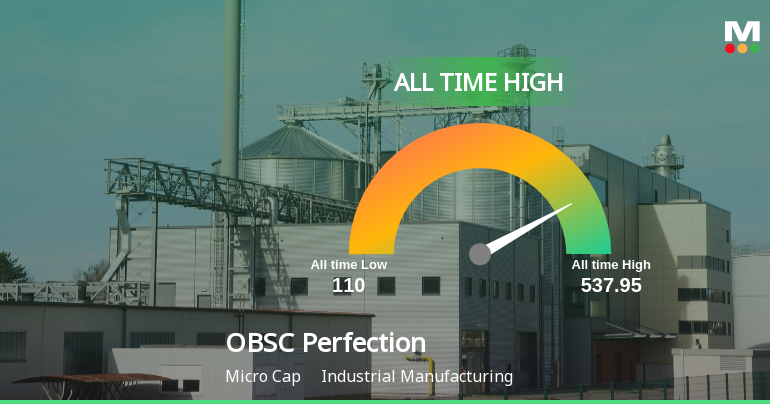
OBSC Perfection Ltd is rated 'Hold' by MarketsMOJO, with this rating last updated on 20 May 2026. However, the analysis and financial metrics discussed here reflect the stock's current position as of 12 June 2026, providing investors with the most up-to-date view of the company’s performance and outlook.
Read full news article
OBSC Perfection Ltd is rated Hold by MarketsMOJO. This rating was established on 20 May 2026, reflecting a comprehensive assessment of the stock’s prospects. However, the analysis and financial metrics presented here are current as of 01 June 2026, providing investors with the latest insights into the company’s performance and outlook.
Read full news article


