
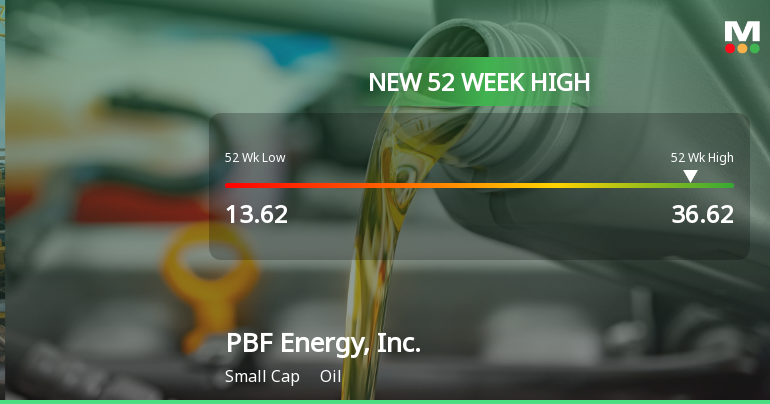
PBF Energy Hits New 52-Week High at $36.62, Showcasing Strong Recovery
2025-10-31 16:15:00PBF Energy, Inc. achieved a new 52-week high of USD 36.62 on October 30, 2025, despite a 1-year performance decline of 24.3%. With a market cap of USD 3,479 million, the company has a dividend yield of 3.91% and a price-to-book ratio of 0.68, though it remains loss-making.
Read full news articleIs PBF Energy, Inc. technically bullish or bearish?
2025-10-28 11:40:20As of 24 October 2025, the technical trend for PBF Energy, Inc. has changed from mildly bullish to bullish. The weekly MACD is bullish, and both the weekly and monthly Bollinger Bands are bullish, indicating positive momentum. Daily moving averages also confirm a bullish stance. However, the KST shows a mixed signal with a bullish weekly but bearish monthly reading, and the Dow Theory indicates a mildly bullish position on both weekly and monthly time frames. The stock has outperformed the S&P 500 significantly over the past week (17.68% vs. 1.92%) and year-to-date (27.34% vs. 15.47%), but it lags over longer periods like 3 years and 1 year. Overall, the current technical stance is bullish with strong short-term momentum....
Read full news article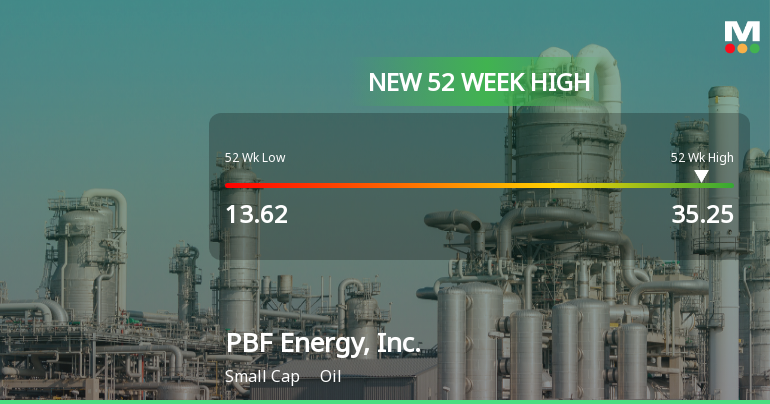
PBF Energy Hits New 52-Week High at $35.25, Marking Significant Milestone
2025-10-27 16:53:24PBF Energy, Inc. achieved a new 52-week high of USD 35.25 on October 24, 2025, marking a significant rebound for the company. Despite this milestone, PBF Energy remains loss-making, with a market capitalization of USD 3,479 million and a negative return on equity of -23.57%.
Read full news articleIs PBF Energy, Inc. technically bullish or bearish?
2025-10-27 11:51:30As of 24 October 2025, the technical trend for PBF Energy, Inc. has changed from mildly bullish to bullish. The weekly MACD is bullish, and both the weekly and monthly Bollinger Bands are bullish, supporting the positive trend. Daily moving averages also indicate a bullish stance. However, the monthly KST is bearish, and the weekly OBV is mildly bearish, which suggests some caution. Overall, the stock has outperformed the S&P 500 in the past week (17.68% vs. 1.92%) and year-to-date (27.34% vs. 15.47%), but it has underperformed over the longer three-year period (-21.93% vs. 78.85%). The current technical stance is bullish, with moderate strength....
Read full news articleIs PBF Energy, Inc. technically bullish or bearish?
2025-10-26 11:26:08As of 24 October 2025, the technical trend for PBF Energy, Inc. has changed from mildly bullish to bullish. The weekly MACD is bullish, and both weekly and monthly Bollinger Bands indicate a bullish stance. Daily moving averages also support a bullish outlook. However, the KST shows a bearish signal on the monthly timeframe, and the OBV is mildly bearish on the weekly. Dow Theory indicates a mildly bullish position in both weekly and monthly perspectives. In terms of performance, PBF Energy has outperformed the S&P 500 significantly over the past week (17.68% vs. 1.92%) and year-to-date (27.34% vs. 15.47%), but it has lagged behind over the longer three-year period (-21.93% vs. 78.85%). Overall, the current technical stance is bullish, with moderate strength driven by positive indicators in the short to medium term....
Read full news article
Corporate Actions


