

Polson Ltd. Downgraded to Strong Sell Amid Weak Fundamentals and Bearish Technicals
2026-07-15 08:04:49Polson Ltd., a micro-cap player in the Specialty Chemicals sector, has seen its investment rating downgraded from Sell to Strong Sell as of 14 July 2026. This revision reflects deteriorating technical indicators, stagnant financial performance, and persistent underperformance relative to benchmarks, signalling heightened risk for investors.
Read full news article
Polson Ltd. Upgraded to Sell from Strong Sell Amid Mixed Technical and Fundamental Signals
2026-07-07 08:14:32Polson Ltd., a micro-cap player in the Specialty Chemicals sector, has seen its investment rating upgraded from Strong Sell to Sell as of 6 July 2026. This change reflects a nuanced shift in the company’s technical outlook, even as its fundamental and financial metrics remain under pressure. The upgrade is primarily driven by improvements in technical indicators, while valuation and financial trends continue to pose challenges for investors.
Read full news article
Polson Ltd. Downgraded to Strong Sell Amid Weak Fundamentals and Bearish Technicals
2026-07-01 08:05:43Polson Ltd., a micro-cap player in the Specialty Chemicals sector, has seen its investment rating downgraded from Sell to Strong Sell as of 30 June 2026. This revision reflects deteriorating technical indicators, stagnant financial performance, and persistent underperformance relative to market benchmarks, signalling heightened risks for investors.
Read full news article
Polson Ltd. Upgraded to Sell on Technical Improvements Despite Weak Fundamentals
2026-06-26 08:04:25Polson Ltd., a micro-cap player in the specialty chemicals sector, has seen its investment rating upgraded from Strong Sell to Sell as of 25 June 2026. This change is primarily driven by a shift in technical indicators, although the company’s fundamental and financial metrics continue to reflect challenges. Investors should weigh the nuanced developments across quality, valuation, financial trends, and technicals before making decisions.
Read full news article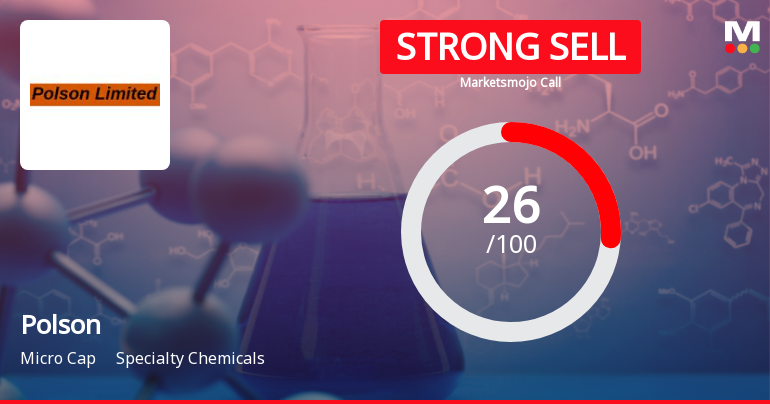
Polson Ltd. Downgraded to Strong Sell Amid Weak Fundamentals and Bearish Technicals
2026-06-19 08:02:47Polson Ltd., a micro-cap player in the specialty chemicals sector, has seen its investment rating downgraded from Sell to Strong Sell as of 18 June 2026. This revision reflects deteriorating technical indicators, stagnant financial performance, and subdued valuation metrics, signalling caution for investors amid a challenging market environment.
Read full news article
Polson Ltd. Upgraded to Sell as Technicals Improve Amidst Flat Financials
2026-06-09 08:14:14Polson Ltd., a micro-cap player in the specialty chemicals sector, has seen its investment rating upgraded from Strong Sell to Sell as of 8 June 2026. This change reflects a nuanced shift in the company’s technical outlook, even as its fundamental and financial performance remains subdued. Investors should weigh the improved technical signals against persistent challenges in profitability and growth before making decisions.
Read full news article
Polson Ltd. Downgraded to Strong Sell Amid Weak Fundamentals and Bearish Technicals
2026-06-04 08:08:49Polson Ltd., a micro-cap player in the Specialty Chemicals sector, has seen its investment rating downgraded from Sell to Strong Sell as of 3 June 2026. This revision reflects deteriorating technical indicators, stagnant financial performance, and persistent underperformance relative to market benchmarks, signalling heightened risks for investors.
Read full news article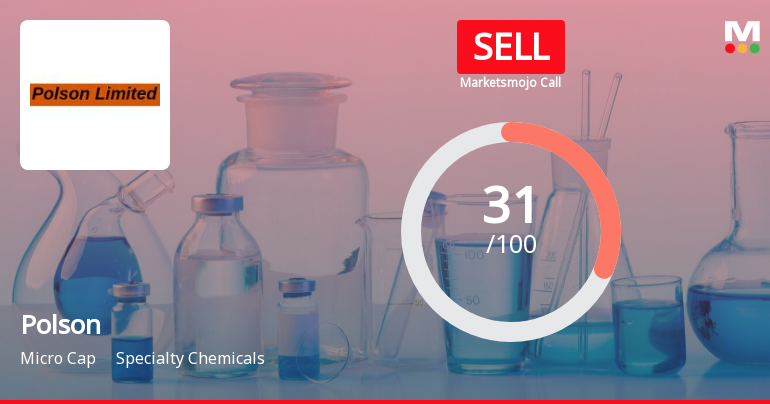
Polson Ltd. is Rated Sell
2026-05-29 10:11:03Polson Ltd. is rated 'Sell' by MarketsMOJO, with this rating last updated on 13 Apr 2026. However, the analysis and financial metrics discussed here reflect the stock's current position as of 29 May 2026, providing investors with an up-to-date perspective on the company’s performance and outlook.
Read full news articleCompliances-Certificate under Reg. 74 (5) of SEBI (DP) Regulations 2018
09-Jul-2026 | Source : BSECompliance Certificate under Regulation 74(5) of SEBI (DP) Regulations 2018 for the quarter ended June 30 2026
Closure of Trading Window
01-Jul-2026 | Source : BSEPursuant to Code for prevention of Insider Trading of Polson Ltd the trading window for dealing in securities of the company will remain closed from Wednesday July 01 2026 in view of the declaration of the financial results of the company for the first quarter ending June 30 2026
Newspaper Publications Regarding Completion Of Dispatch Of Notice Of Postal Ballot Dated 16Th June 2026
18-Jun-2026 | Source : BSENewspaper publications regarding completion of dispatched of Notice of Postal Ballot dated 16th June 2026
Corporate Actions

No Upcoming Board Meetings

No Dividend history available

No Splits history available

No Bonus history available

No Rights history available


