


Key Events This Week
25 May: Sharp 9.31% price drop to Rs.142.20 amid technical downshift
26 May: Valuation metrics upgraded to attractive despite price decline
27 May: Minor price correction to Rs.142.25 (-0.63%)
29 May: Week closes at Rs.138.60, down 2.57% on the day
Prostarm Info Systems Ltd Faces Technical Downshift Amid Price Momentum Weakness
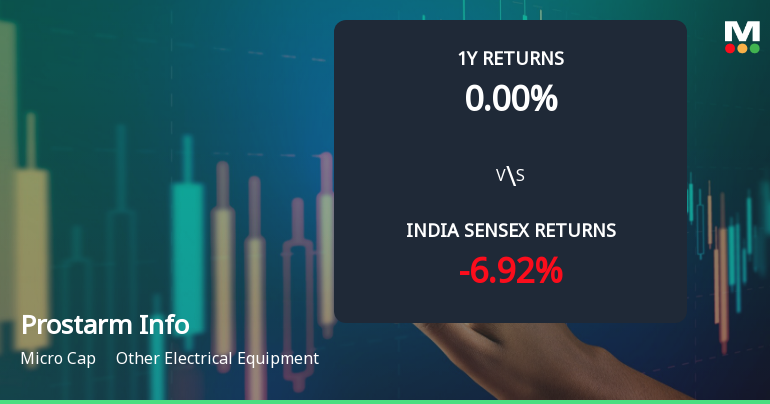
2026-05-26 08:07:44Prostarm Info Systems Ltd, a micro-cap player in the Other Electrical Equipment sector, has experienced a notable shift in its technical momentum, reflected in a downgrade from Hold to Sell by MarketsMOJO. The stock’s price has declined sharply by 9.31% in a single day, signalling increased bearish sentiment amid mixed technical indicators and a challenging market backdrop.
Read full news article
Prostarm Info Systems Ltd Valuation Shifts Signal Renewed Price Attractiveness
2026-05-26 08:02:42Prostarm Info Systems Ltd has seen a notable shift in its valuation metrics, moving from a fair to an attractive valuation grade despite a sharp 9.3% decline in its share price on 26 May 2026. This change reflects evolving investor sentiment and a reassessment of the company’s price-to-earnings and price-to-book value ratios relative to its historical averages and peer group, signalling a potential opportunity for value-focused investors in the Other Electrical Equipment sector.
Read full news articleAre Prostarm Info Systems Ltd latest results good or bad?
2026-05-23 19:26:42Prostarm Info Systems Ltd's latest financial results for Q4 FY26 present a mixed picture, characterized by significant revenue fluctuations and margin pressures. The company reported net sales of ₹104.45 crores, reflecting a year-on-year growth of 27.35%, but this figure is overshadowed by a sequential decline of 34.92% from the previous quarter. Similarly, net profit for the quarter stood at ₹7.95 crores, which is a 17.08% increase year-on-year but a notable drop of 46.68% compared to the prior quarter. The operating margin, excluding other income, contracted to 10.48%, down from 12.62% in the previous quarter, indicating challenges in maintaining profitability amidst fluctuating revenues. This decline in operating margin is part of a broader trend, as the company has experienced a significant reduction in operating profit margins over the past six quarters, which raises concerns about competitive pressur...
Read full news article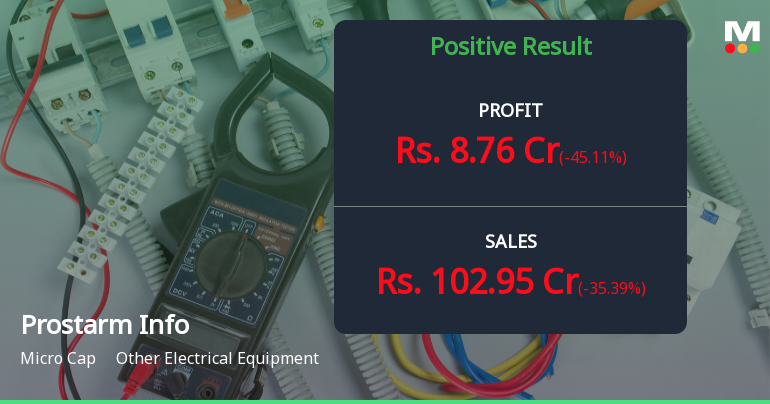
Prostarm Info Systems Q4 FY26: Profit Surge Masked by Revenue Volatility and Margin Compression
2026-05-23 11:49:52Prostarm Info Systems Ltd., a micro-cap player in the electrical equipment sector with a market capitalisation of ₹954.00 crores, reported a mixed Q4 FY26 performance marked by sharp sequential revenue contraction and compressed operating margins, even as annual profit growth remained robust. The company posted a consolidated net profit of ₹7.95 crores for the March 2026 quarter, up 17.08% year-on-year but down a steep 46.68% quarter-on-quarter, reflecting the project-driven volatility inherent in its business model. The stock traded at ₹156.80 on May 22, 2026, down 2.61% on the day, as investors digested the erratic quarterly trajectory and elevated valuation concerns.
Read full news article


