
Is RBC Bearings, Inc. technically bullish or bearish?
2025-11-05 11:18:48As of 31 October 2025, the technical trend for RBC Bearings, Inc. has changed from mildly bullish to bullish. The MACD is bullish on both weekly and monthly time frames, and daily moving averages also indicate a bullish stance. While the Bollinger Bands show a mildly bullish trend on both weekly and monthly levels, the KST presents a mixed signal with a mildly bearish weekly reading but a bullish monthly reading. The Dow Theory and OBV show no trend in both weekly and monthly assessments. In terms of performance, RBC Bearings has outperformed the S&P 500 across multiple periods, with a year-to-date return of 42.82% compared to the S&P 500's 16.30%, and a one-year return of 49.75% versus 19.89%. Overall, the current technical stance is bullish, supported by strong MACD and moving average signals....
Read full news articleIs RBC Bearings, Inc. technically bullish or bearish?
2025-11-04 11:30:04As of 31 October 2025, the technical trend for RBC Bearings, Inc. has changed from mildly bullish to bullish. The weekly and monthly MACD indicators are both bullish, supporting a positive outlook. Additionally, Bollinger Bands are bullish on both time frames, and daily moving averages also indicate a bullish stance. However, the KST shows a mildly bearish signal on the weekly chart, and the OBV is mildly bearish on the monthly chart, suggesting some caution. In terms of performance, RBC Bearings has outperformed the S&P 500 significantly over the past week (4.21% vs. 0.71%) and month (14.55% vs. 1.92%), while year-to-date and one-year returns are also strong at 43.21% and 50.16%, respectively, compared to the S&P 500's 16.30% and 19.89%. Overall, the current technical stance is bullish, with strong indicators driving this sentiment....
Read full news article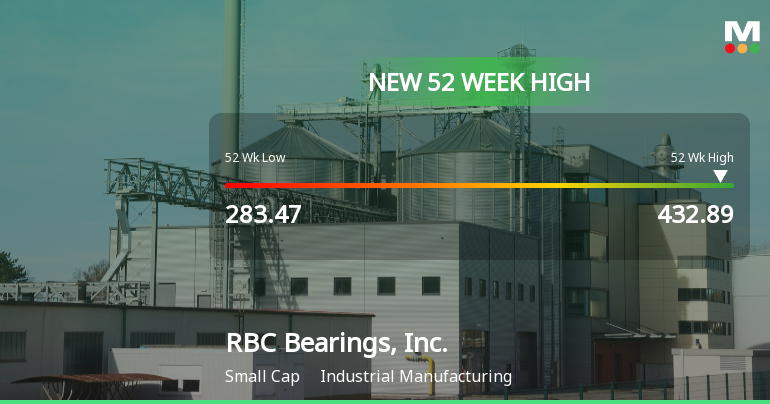
RBC Bearings, Inc. Hits New 52-Week High of $432.89
2025-11-03 17:03:08RBC Bearings, Inc. has achieved a new 52-week high, reflecting a strong performance with a notable increase over the past year. The company, with a market capitalization of USD 12,406 million, maintains a premium P/E ratio and a conservative debt-to-equity ratio, indicating solid financial health.
Read full news articleIs RBC Bearings, Inc. technically bullish or bearish?
2025-11-03 11:29:12As of 31 October 2025, the technical trend for RBC Bearings, Inc. has changed from mildly bullish to bullish. The weekly and monthly MACD indicators are bullish, and Bollinger Bands also reflect a bullish stance across both time frames. Daily moving averages confirm a bullish trend. However, the KST shows a mildly bearish signal on the weekly chart, while the monthly remains bullish. Dow Theory indicates a bullish trend on the weekly but no trend on the monthly. The OBV is mildly bearish on the monthly and shows no trend on the weekly. RBC Bearings has outperformed the S&P 500 across multiple periods, with a year-to-date return of 43.25% compared to the S&P 500's 16.30%, and a one-year return of 52.86% versus 19.89%. Overall, the current technical stance is bullish, supported by strong momentum indicators, despite some mixed signals in the KST and OBV....
Read full news articleIs RBC Bearings, Inc. technically bullish or bearish?
2025-11-02 11:15:31As of 31 October 2025, the technical trend for RBC Bearings, Inc. has changed from mildly bullish to bullish. The weekly and monthly MACD indicators are both bullish, and Bollinger Bands also indicate a bullish stance on both time frames. Daily moving averages are bullish as well. However, the KST shows a mildly bearish signal on the weekly, while the monthly remains bullish. Dow Theory indicates a bullish trend on the weekly but shows no trend on the monthly. The OBV is mildly bearish on the monthly and shows no trend on the weekly. RBC Bearings has outperformed the S&P 500 across multiple periods, with a year-to-date return of 43.25% compared to the S&P 500's 16.30%, and a one-year return of 52.86% versus 19.89%. Overall, the current technical stance is bullish, supported by strong indicators, although some mixed signals exist in the KST and OBV....
Read full news article
Corporate Actions


