


Key Events This Week
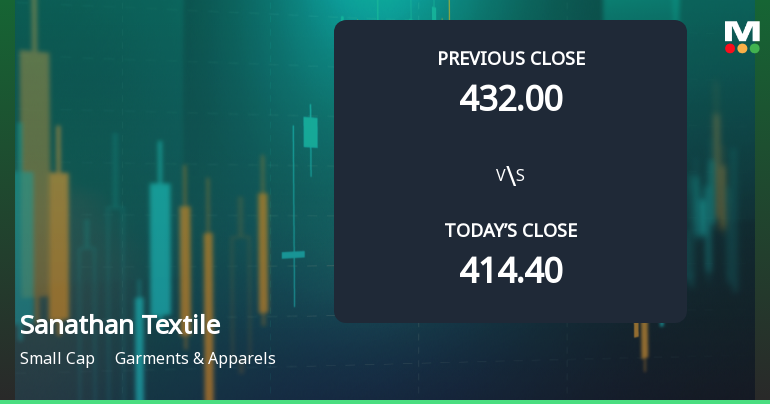
18 May: Stock opens at ₹430.00, modest gain despite Sensex decline
19 May: Downgrade to Strong Sell announced; stock drops 4.53% to ₹410.50
20 May: Technical indicators shift bearish amid continued price weakness
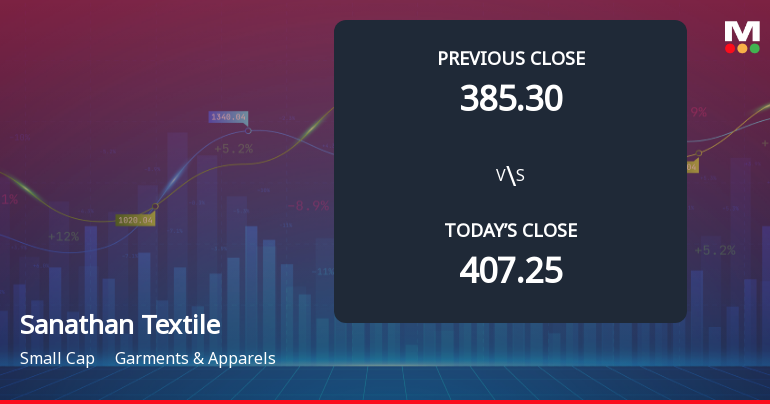
22 May: Week closes at ₹407.80, down 0.89% on the day
Week Open
Rs.428.25
Week Close