
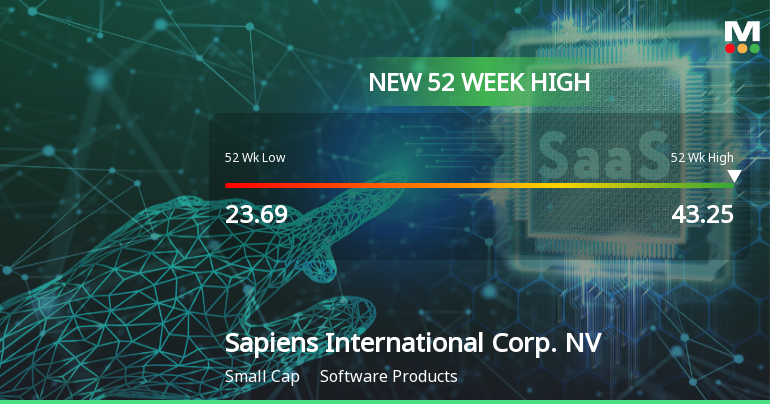
Sapiens International Corp. Hits New 52-Week High of $43.25
2025-11-14 15:50:50Sapiens International Corp. NV achieved a new 52-week high of USD 43.25 on November 13, 2025, reflecting a one-year growth of 29.99%. With a market capitalization of USD 2,504 million, the company demonstrates strong financial health, marked by a competitive P/E ratio and efficient return on equity.
Read More
Sapiens International Corp. Hits New 52-Week High of $43.21
2025-11-04 17:45:59Sapiens International Corp. NV achieved a new 52-week high of USD 43.21 on November 3, 2025, reflecting strong performance in the software products sector. With a market cap of USD 2,504 million, the company shows robust valuation metrics and a solid financial position, underscoring its market success.
Read MoreIs Sapiens International Corp. NV technically bullish or bearish?
2025-10-07 12:14:14As of 3 October 2025, the technical trend for Sapiens International Corp. NV has changed from bullish to mildly bullish. The weekly MACD and Bollinger Bands are bullish, while the weekly RSI is bearish, indicating mixed signals. The daily moving averages are bullish, suggesting short-term strength. However, the KST is bullish weekly but mildly bearish monthly, and the OBV shows a mildly bearish stance weekly. Overall, the current technical stance is mildly bullish, with strength primarily driven by the bullish MACD and moving averages. In terms of performance, Sapiens has outperformed the S&P 500 year-to-date with a return of 60.18% compared to the S&P's 14.18%, but has lagged over the 5-year period, returning 42.00% versus the S&P's 100.56%....
Read MoreIs Sapiens International Corp. NV technically bullish or bearish?
2025-10-06 12:04:41As of 3 October 2025, the technical trend for Sapiens International Corp. NV has changed from bullish to mildly bullish. The weekly MACD and Bollinger Bands indicate a bullish stance, while the weekly RSI is bearish, suggesting mixed signals. The daily moving averages are bullish, but the KST shows a mildly bearish trend on a monthly basis. Overall, the stock has outperformed the S&P 500 year-to-date with a return of 60.10% compared to 14.18%. However, over the longer term, the 5-year return of 40.59% lags behind the S&P 500's 100.56%. The current technical stance is mildly bullish, driven by the bullish MACD and moving averages, tempered by the bearish RSI and OBV....
Read MoreIs Sapiens International Corp. NV technically bullish or bearish?
2025-10-05 11:49:34As of 3 October 2025, the technical trend for Sapiens International Corp. NV has changed from bullish to mildly bullish. The weekly MACD and Bollinger Bands indicate a bullish stance, while the weekly RSI is bearish, suggesting mixed signals. The daily moving averages are bullish, but the KST shows a mildly bearish trend on the monthly timeframe. The Dow Theory indicates no trend on both weekly and monthly charts, and the OBV is mildly bearish on the weekly basis. In terms of performance, Sapiens has outperformed the S&P 500 year-to-date with a return of 60.10% compared to the S&P 500's 14.18%, but it has lagged over the 5-year period, returning 40.59% versus the S&P 500's 100.56%. Overall, the current technical stance is mildly bullish, driven primarily by the bullish MACD and Bollinger Bands, tempered by the bearish RSI and KST....
Read MoreIs Sapiens International Corp. NV technically bullish or bearish?
2025-09-20 19:04:46As of 3 September 2025, the technical trend for Sapiens International Corp. NV has changed from mildly bullish to bullish. The current stance is bullish with strong indicators supporting this view. The MACD is bullish on both weekly and monthly time frames, and Bollinger Bands also indicate bullish momentum in both time frames. Moving averages are bullish on the daily chart. However, the KST shows a mildly bearish signal on the monthly, and the OBV is mildly bearish on the weekly, suggesting some caution. In terms of performance, Sapiens has outperformed the S&P 500 significantly year-to-date with a return of 60.22% compared to the S&P 500's 12.22%, and over three years, it has returned 111.44% versus 70.41% for the benchmark....
Read MoreIs Sapiens International Corp. NV overvalued or undervalued?
2025-09-20 17:38:21As of 8 August 2025, the valuation grade for Sapiens International Corp. NV has moved from attractive to fair. The company appears to be fairly valued based on its current metrics, with a P/E ratio of 22, a Price to Book Value of 3.76, and an EV to EBITDA of 14.47. In comparison to its peers, Clearwater Analytics Holdings, Inc. has a much lower P/E of 12.49, while Agilysys, Inc. is deemed very expensive with a P/E of 275.52. Despite the fair valuation, Sapiens has demonstrated strong performance with a year-to-date return of 60.22%, significantly outperforming the S&P 500's 12.22% during the same period. This suggests that while the stock may be fairly valued, its recent performance indicates positive investor sentiment....
Read More
Sapiens International Corp. Hits New 52-Week High of $43.17
2025-09-18 13:11:04Sapiens International Corp. NV achieved a new 52-week high, reflecting its strong performance in the software products industry with a one-year growth of 29.39%. The company, with a market cap of USD 2,504 million, showcases effective management through its return on equity and a solid balance sheet.
Read More
Corporate Actions


