
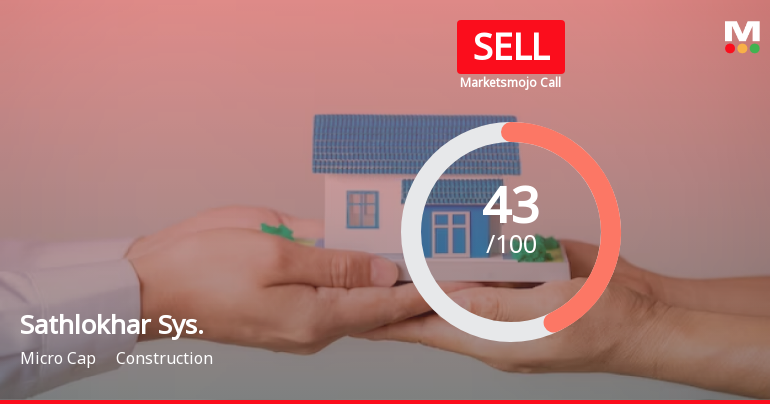
Sathlokhar Synergys E&C Global Ltd is Rated Sell
2026-07-02 10:10:04Sathlokhar Synergys E&C Global Ltd is rated Sell by MarketsMOJO. This rating was last updated on 29 May 2026, reflecting a new assessment of the stock’s outlook. However, all fundamentals, returns, and financial metrics discussed here are current as of 02 July 2026, providing investors with the latest view of the company’s position in the market.
Read full news article
Sathlokhar Synergys E&C Global Ltd is Rated Sell
2026-06-21 10:10:14Sathlokhar Synergys E&C Global Ltd is rated 'Sell' by MarketsMOJO, with this rating last updated on 29 May 2026. However, the analysis and financial metrics discussed below reflect the stock’s current position as of 21 June 2026, providing investors with an up-to-date view of the company’s fundamentals, valuation, financial trend, and technical outlook.
Read full news article
Sathlokhar Synergys E&C Global Ltd Faces Bearish Momentum Amid Technical Downturn
2026-06-16 08:07:59Sathlokhar Synergys E&C Global Ltd, a micro-cap player in the construction sector, has seen a marked shift in its technical momentum, with key indicators signalling a bearish trend. The stock’s recent price action and technical parameters suggest increasing downside risks, contrasting with broader market resilience as reflected by the Sensex.
Read full news article
Sathlokhar Synergys E&C Global Ltd Technical Momentum Shifts Amid Bearish Trends
2026-06-15 08:05:50Sathlokhar Synergys E&C Global Ltd, a micro-cap player in the construction sector, has exhibited a nuanced shift in its technical momentum, moving from a bearish to a mildly bearish trend. Despite a modest 2.95% gain on 15 Jun 2026, the stock’s broader technical indicators reveal a complex picture of mixed signals, underscoring the challenges faced by investors amid subdued price momentum and sector headwinds.
Read full news article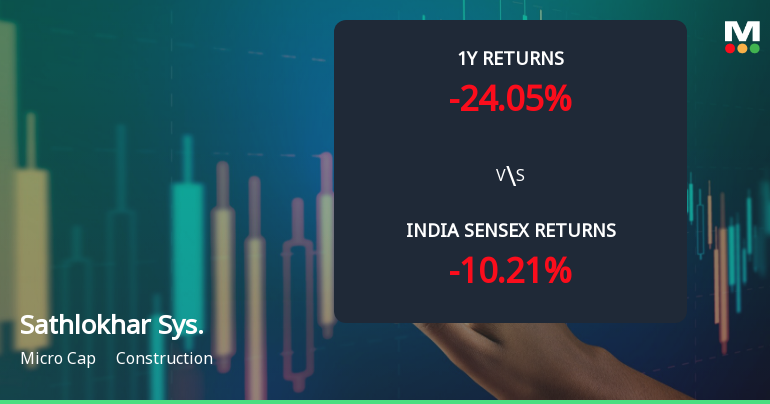
Sathlokhar Synergys E&C Global Ltd Faces Bearish Momentum Amid Technical Downturn
2026-06-11 08:05:40Sathlokhar Synergys E&C Global Ltd, a micro-cap player in the construction sector, is currently exhibiting a pronounced bearish momentum as technical indicators signal a shift towards a more negative trend. The stock’s recent price action, combined with deteriorating momentum metrics, suggests caution for investors amid a challenging market backdrop.
Read full news article
Sathlokhar Synergys E&C Global Ltd is Rated Sell
2026-06-10 10:10:05Sathlokhar Synergys E&C Global Ltd is rated 'Sell' by MarketsMOJO, with this rating last updated on 29 May 2026. However, all fundamentals, returns, and financial metrics discussed here reflect the stock's current position as of 10 June 2026, providing investors with an up-to-date analysis of the company’s standing.
Read full news article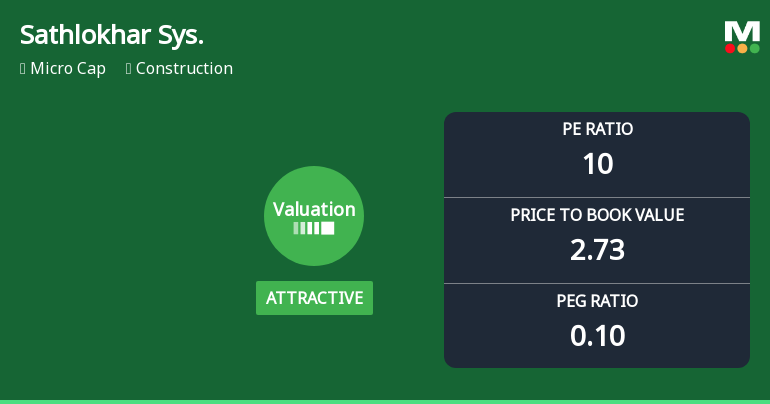
Sathlokhar Synergys E&C Global Ltd Valuation Shifts Signal Renewed Price Attractiveness
2026-06-01 08:08:39Sathlokhar Synergys E&C Global Ltd, a micro-cap player in the construction sector, has recently undergone a notable shift in its valuation parameters, moving from a fair to an attractive rating. This change is underscored by a significant improvement in key metrics such as the price-to-earnings (P/E) ratio and price-to-book value (P/BV), positioning the stock as a compelling consideration amid a challenging market backdrop.
Read full news article
Sathlokhar Synergys E&C Global Ltd is Rated Sell
2026-05-30 10:10:04Sathlokhar Synergys E&C Global Ltd is rated 'Sell' by MarketsMOJO, with this rating last updated on 29 May 2026. However, the analysis and financial metrics discussed here reflect the stock’s current position as of 30 May 2026, providing investors with the most up-to-date view of the company’s performance and outlook.
Read full news article
Corporate Actions

No Upcoming Board Meetings

No Dividend history available

No Splits history available

No Bonus history available

No Rights history available


