

Key Events This Week
25 May: Stock plunges 8.12% to Rs.58.73 on heavy selling pressure
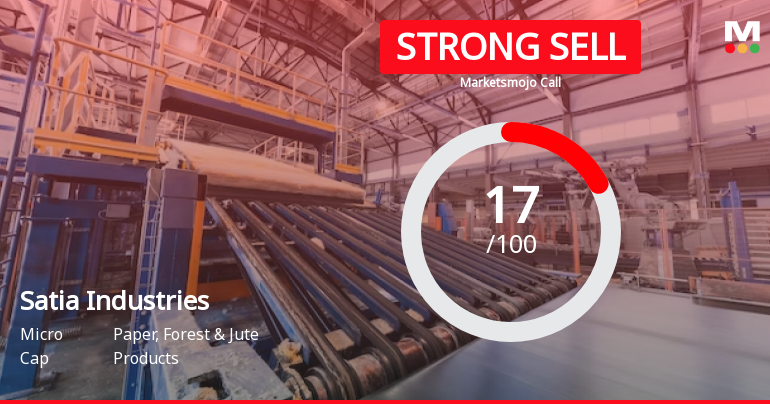
26 May: Downgrade to Strong Sell by MarketsMOJO amid valuation and financial concerns
26 May: Valuation metrics shift to “risky” signalling elevated investor caution
29 May: Week closes at Rs.57.57, down 2.42% on the day

Satia Industries Ltd Downgraded to Strong Sell Amid Valuation and Financial Concerns
2026-05-26 08:51:20Satia Industries Ltd, a micro-cap player in the Paper, Forest & Jute Products sector, has been downgraded from a Sell to a Strong Sell rating as of 25 May 2026. This revision reflects deteriorating valuation metrics, weakening financial trends, and negative technical signals, signalling heightened risk for investors amid persistent operational challenges and underperformance against benchmarks.
Read full news article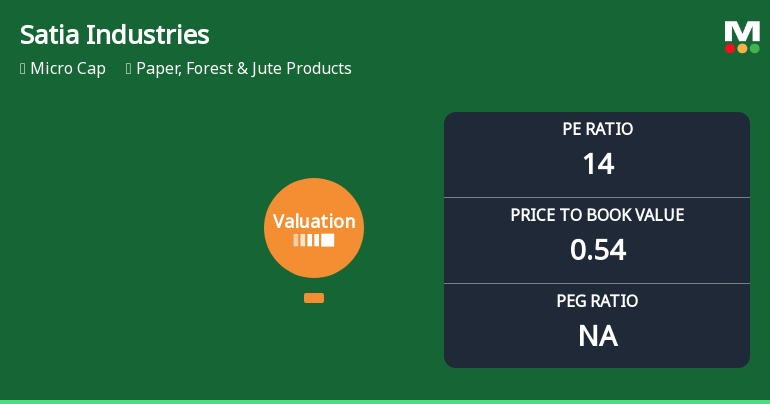
Satia Industries Ltd Valuation Shifts Signal Elevated Risk Amid Market Downturn
2026-05-26 08:00:49Satia Industries Ltd, a micro-cap player in the Paper, Forest & Jute Products sector, has seen a marked deterioration in its valuation attractiveness, with key metrics signalling increased risk for investors. The company’s price-to-earnings (P/E) ratio now stands at 14.41, while its price-to-book value (P/BV) remains low at 0.54, reflecting a complex valuation landscape amid weak operational returns and a sharp share price decline.
Read full news articleAre Satia Industries Ltd latest results good or bad?
2026-05-24 19:13:33Satia Industries Ltd's latest financial results for the quarter ended March 2026 indicate significant operational challenges. The company reported net sales of ₹389.56 crores, reflecting a year-on-year decline of 1.79%. While there was a modest quarter-on-quarter growth of 2.43%, the overall trend suggests weak demand conditions in the paper industry. Profitability metrics showed a marked deterioration, with standalone net profit plummeting by 83.63% compared to the same quarter last year, resulting in a net profit of ₹5.80 crores. This decline was exacerbated by a substantial contraction in operating profit before depreciation, interest, tax, and other income (PBDIT), which fell by 72.52% year-on-year to ₹16.90 crores. The operating margin, excluding other income, also contracted sharply to 4.34%, down from 15.50% in the previous year, indicating severe margin pressure. The company experienced a signific...
Read full news article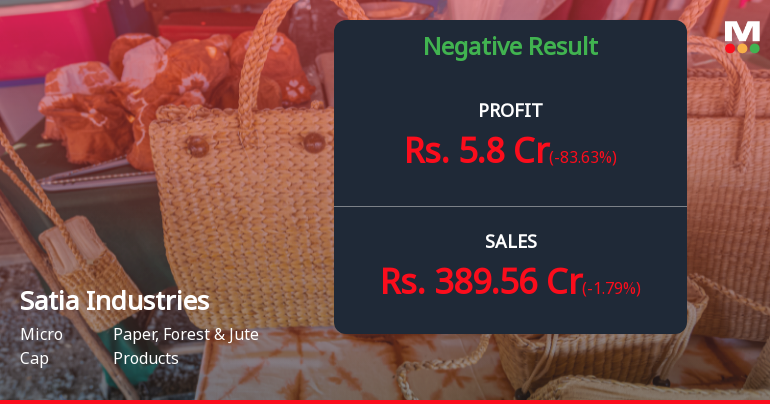
Satia Industries Q4 FY26: Margin Collapse and Loss-Making Quarter Raise Red Flags
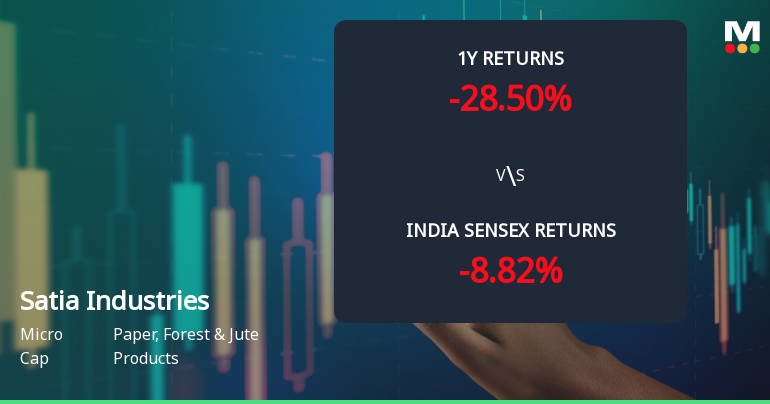
2026-05-23 22:45:44Satia Industries Ltd., a micro-cap paper manufacturer with a market capitalisation of ₹643.00 crores, reported deeply concerning results for Q4 FY26 (Mar'26), with the company slipping into a loss-making position at the operating level before other income. Net profit collapsed 83.60% quarter-on-quarter to ₹5.80 crores, whilst operating margins excluding other income plummeted to just 4.34% from 10.12% in the previous quarter. The stock, trading at ₹63.92, has declined 20.87% over the past year, significantly underperforming both the Sensex and its sector.
Read full news article
Satia Industries Ltd is Rated Sell
2026-05-20 10:10:37Satia Industries Ltd is rated 'Sell' by MarketsMOJO, with this rating last updated on 09 Feb 2026. However, the analysis and financial metrics discussed here reflect the stock's current position as of 20 May 2026, providing investors with the latest insights into its performance and outlook.
Read full news article


