
Key Events This Week
18 May: Valuation metrics upgraded to "very attractive" amid price softness
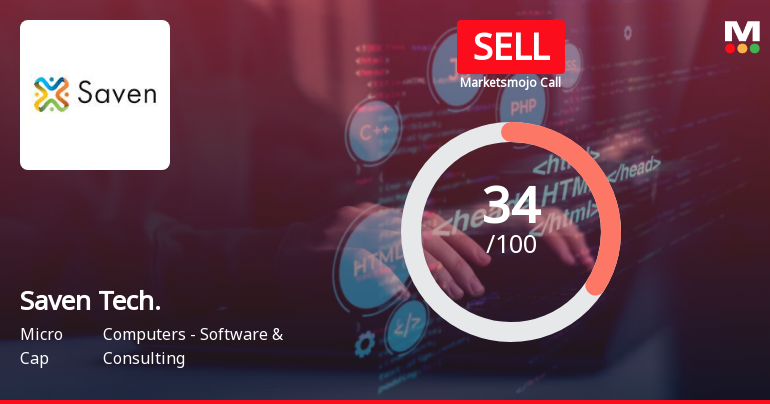
19 May: MarketsMOJO upgrades rating from Strong Sell to Sell
20 May: Stock price rises 1.33% on improved technical indicators
22 May: Strong rally closes week at ₹36.26, +5.59% on the day
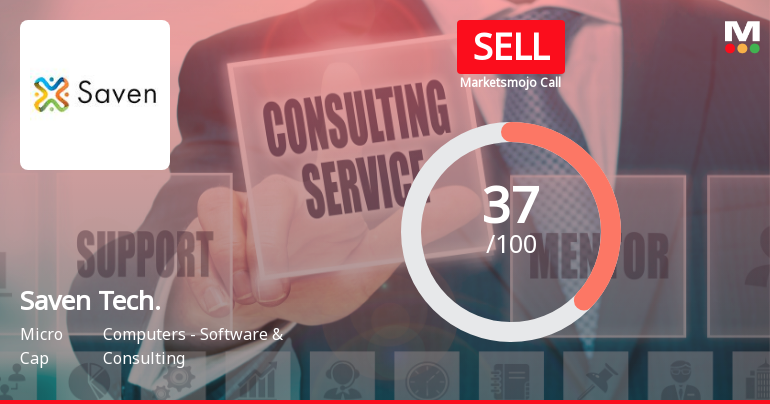
Saven Technologies Ltd Upgraded to Sell on Improved Technicals and Valuation
2026-05-20 08:01:16Saven Technologies Ltd, a micro-cap player in the Computers - Software & Consulting sector, has seen its investment rating upgraded from Strong Sell to Sell as of 19 May 2026. This change reflects a nuanced improvement across technical indicators and valuation metrics, despite ongoing challenges in financial trends and quality assessments. The company’s current Mojo Score stands at 37.0, signalling a cautious but less negative outlook compared to its previous standing.
Read full news article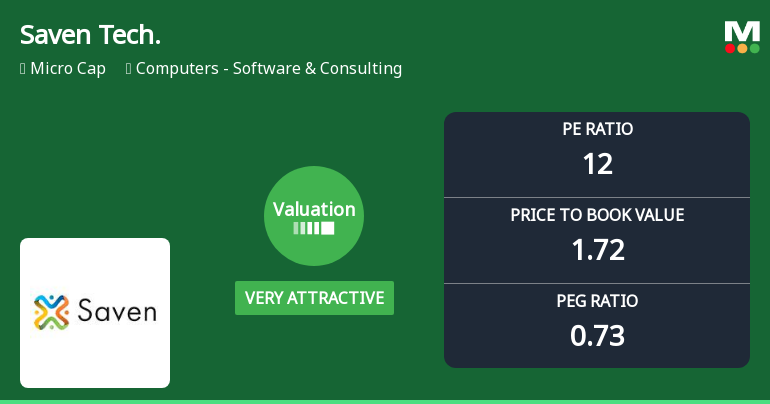
Saven Technologies Ltd Valuation Shifts Signal Renewed Price Attractiveness
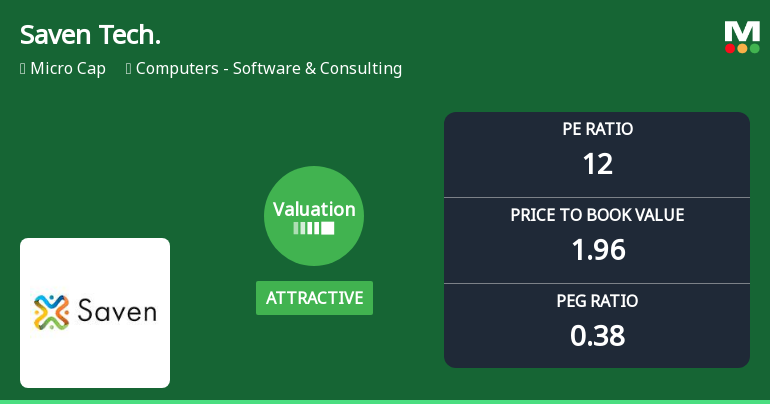
2026-05-18 08:00:27Saven Technologies Ltd, a micro-cap player in the Computers - Software & Consulting sector, has witnessed a notable shift in its valuation parameters, moving from an attractive to a very attractive rating. Despite recent share price declines, the company’s improved price-to-earnings (P/E) and price-to-book value (P/BV) ratios relative to peers and historical averages suggest a compelling investment opportunity for value-focused investors.
Read full news articleSaven Technologies Declines 8.11%: Valuation Gains Offset by Technical Weakness
2026-05-17 13:00:04
Key Events This Week
May 11: Valuation upgrade to attractive rating announced
May 12: Continued price decline amid broader market weakness
May 13: Sharp rebound with 6.55% gain on low volume
May 14: Technical downgrade to Strong Sell rating revealed
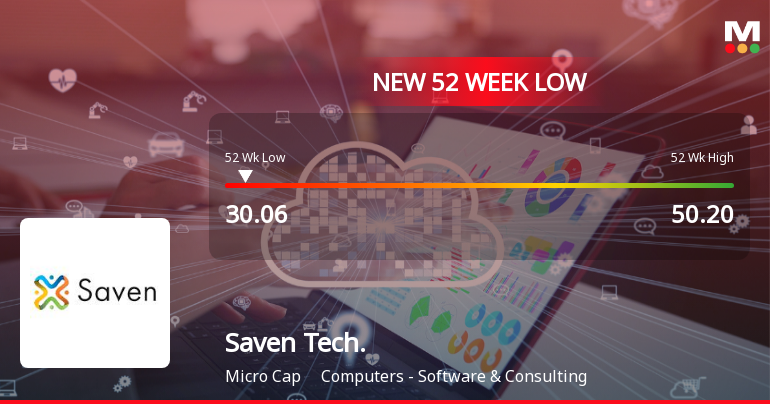
May 15: Week closes at Rs.34.43, down 8.11%
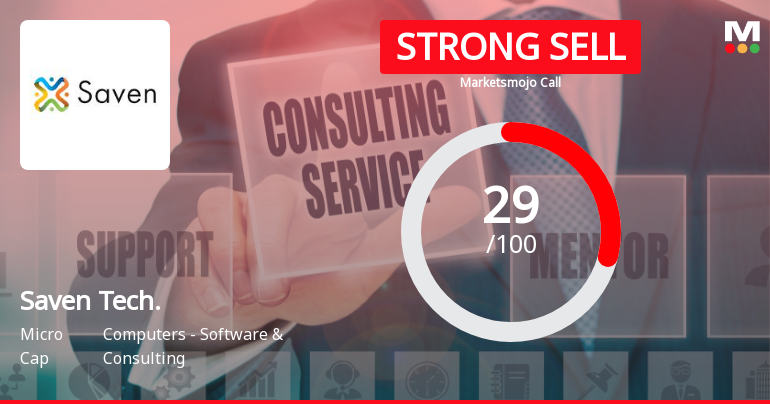
Saven Technologies Ltd Downgraded to Strong Sell Amid Mixed Technicals and Valuation Appeal
2026-05-15 08:00:50Saven Technologies Ltd has seen its investment rating upgraded from Sell to Strong Sell as of 14 May 2026, driven primarily by improvements in its technical indicators and valuation metrics. Despite ongoing challenges in financial trends and quality assessments, the company’s micro-cap status and recent market movements have prompted a reassessment of its outlook within the Computers - Software & Consulting sector.
Read full news articleAnnouncement under Regulation 30 (LODR)-Newspaper Publication
23-May-2026 | Source : BSEAttached
Board Meeting Outcome for Outcome Of The Board Meeting
22-May-2026 | Source : BSEAttached
Results
22-May-2026 | Source : BSEAttached
Corporate Actions

No Upcoming Board Meetings

Saven Technologies Ltd has declared 150% dividend, ex-date: 16 Feb 26

No Splits history available

No Bonus history available

No Rights history available


