
ScanSource, Inc. Experiences Revision in Stock Evaluation Amid Market Challenges
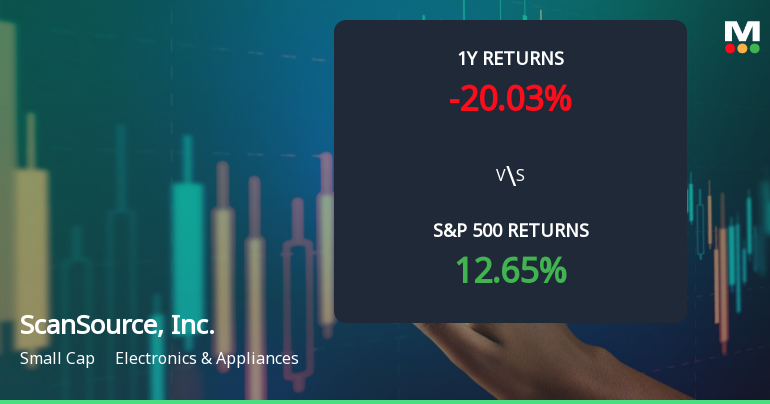
2025-11-10 15:24:19ScanSource, Inc. has recently seen a technical trend adjustment, with its stock price at $40.60. Over the past year, the company has faced a notable decline of 20.03%, contrasting with the S&P 500's positive performance. Various technical indicators suggest a cautious outlook for the stock.
Read full news articleIs ScanSource, Inc. technically bullish or bearish?
2025-11-05 11:18:07As of 31 October 2025, the technical trend for ScanSource, Inc. has changed from mildly bearish to sideways. The current stance is neutral, with mixed indicators influencing this position. The MACD is mildly bearish on both weekly and monthly time frames, while the Bollinger Bands indicate a sideways trend weekly and bearish monthly. Daily moving averages show a mildly bullish signal, but the KST is bearish on both weekly and monthly charts. Additionally, Dow Theory and OBV show no trend in either time frame. In terms of performance, ScanSource has underperformed the S&P 500 across multiple periods, with a year-to-date return of -13.45% compared to the S&P 500's 16.30%, and a one-year return of -5.54% versus 19.89%. Overall, the technical indicators suggest a cautious approach given the mixed signals and underperformance relative to the benchmark....
Read full news articleIs ScanSource, Inc. technically bullish or bearish?
2025-11-04 11:29:26As of 31 October 2025, the technical trend for ScanSource, Inc. has changed from mildly bearish to sideways. The current technical stance is neutral, with mixed indicators influencing this view. The weekly MACD and KST are both mildly bearish, while the monthly indicators also reflect mild bearishness. However, the daily moving averages and Dow Theory show a mildly bullish stance. The Bollinger Bands indicate a mixed signal with a mildly bullish weekly view but bearish monthly. In terms of performance, ScanSource has underperformed the S&P 500 across multiple periods, with a year-to-date return of -10.90% compared to the S&P 500's 16.30%, and a one-year return of -2.76% against the S&P 500's 19.89%....
Read full news articleIs ScanSource, Inc. technically bullish or bearish?
2025-11-03 11:28:23As of 31 October 2025, the technical trend for ScanSource, Inc. has changed from mildly bearish to sideways. The current stance is neutral, with mixed signals across various indicators. The MACD shows a mildly bearish trend on both weekly and monthly time frames, while the Bollinger Bands indicate a mildly bullish stance weekly but bearish monthly. Moving averages are mildly bullish on a daily basis, and Dow Theory supports a mildly bullish view on both weekly and monthly scales. However, the KST and OBV are both mildly bearish. In terms of performance, ScanSource has underperformed the S&P 500 across multiple periods, with a year-to-date return of -9.58% compared to the S&P 500's 16.30%, although it has outperformed the benchmark over the 3-year and 5-year periods....
Read full news articleIs ScanSource, Inc. technically bullish or bearish?
2025-11-02 11:14:52As of 31 October 2025, the technical trend for ScanSource, Inc. has changed from mildly bearish to sideways. The current technical stance is neutral, with mixed indicators across different time frames. The weekly MACD and KST are both mildly bearish, while the monthly indicators also reflect a bearish sentiment. However, the daily moving averages and Dow Theory show a mildly bullish stance. The Bollinger Bands present a mixed view with a mildly bullish weekly signal but a bearish monthly signal. In terms of performance, ScanSource has underperformed the S&P 500 over the past week, month, and year, with a year-to-date return of -9.58% compared to the S&P 500's 16.30%. Over the longer term, however, the 3-year return of 38.49% is notable, though still trailing the S&P 500's 76.66%. Overall, the mixed signals suggest a cautious approach....
Read full news article
Corporate Actions


