

Key Events This Week
29 Jun: Week opens at Rs.22.25
30 Jun: Stock hits 52-week low of Rs.19.5 amid continued downtrend
1 Jul: Valuation turns very attractive with P/E at 8.63 and P/BV at 0.52
3 Jul: Week closes at Rs.21.96, down 1.30%
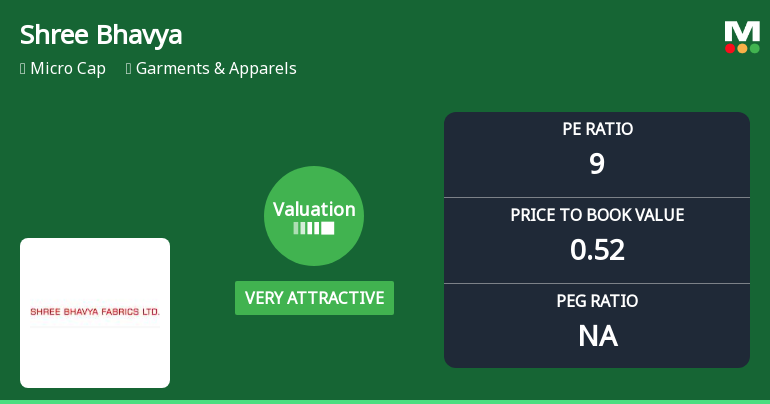
Shree Bhavya Fabrics Ltd Valuation Turns Very Attractive Amid Market Pressure
2026-07-01 08:00:06Shree Bhavya Fabrics Ltd, a micro-cap player in the Garments & Apparels sector, has seen a marked shift in its valuation parameters, moving from an attractive to a very attractive rating. Despite a sharp decline in its share price, the company’s price-to-earnings (P/E) and price-to-book value (P/BV) ratios now present a compelling case for value investors, especially when compared to its peers and historical benchmarks.
Read full news article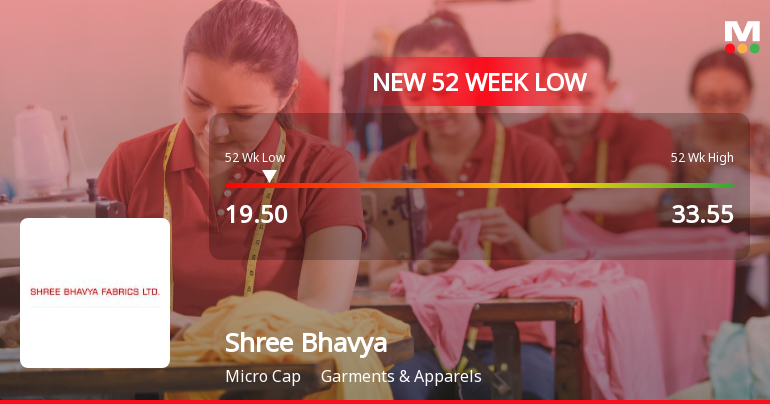
Shree Bhavya Fabrics Ltd Falls to 52-Week Low of Rs 19.5 as Sell-Off Deepens
2026-06-30 14:35:09For the fourth consecutive session, Shree Bhavya Fabrics Ltd has seen its share price decline, culminating in a fresh 52-week low of Rs 19.5 on 30 Jun 2026. This marks a significant 41.9% drop from its 52-week high of Rs 33.55, underscoring persistent selling pressure amid a volatile trading environment.
Read full news article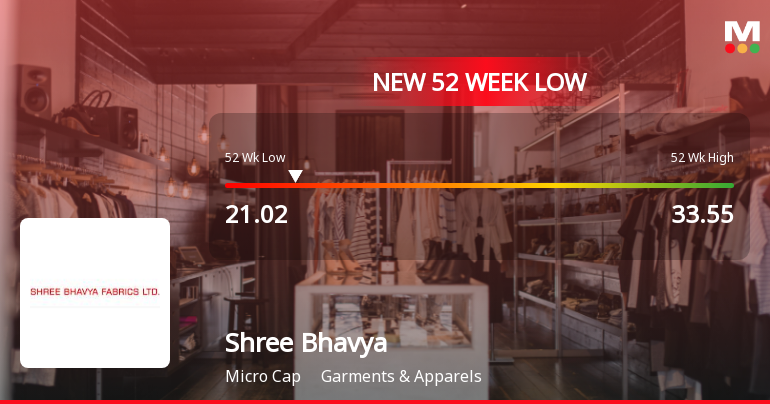
Shree Bhavya Fabrics Ltd Falls to 52-Week Low of Rs 21.02 as Sell-Off Deepens
2026-06-12 13:35:07For the second consecutive day, Shree Bhavya Fabrics Ltd slipped further, hitting a fresh 52-week low of Rs 21.02 on 12 Jun 2026, despite a modest 0.71% gain on the day. This decline comes amid a broader market rally, with the Sensex advancing 1.29% and trading well above its own 52-week low.
Read full news article
Shree Bhavya Fabrics Ltd Falls to 52-Week Low of Rs 21.99 as Sell-Off Deepens
2026-06-09 12:40:08For the second consecutive session, Shree Bhavya Fabrics Ltd has slipped further, hitting a fresh 52-week low of Rs 21.99 on 9 Jun 2026. This decline comes despite a broader market that has shown some resilience, with the Sensex trading 3.04% above its own 52-week low and gaining 0.37% on the day.
Read full news article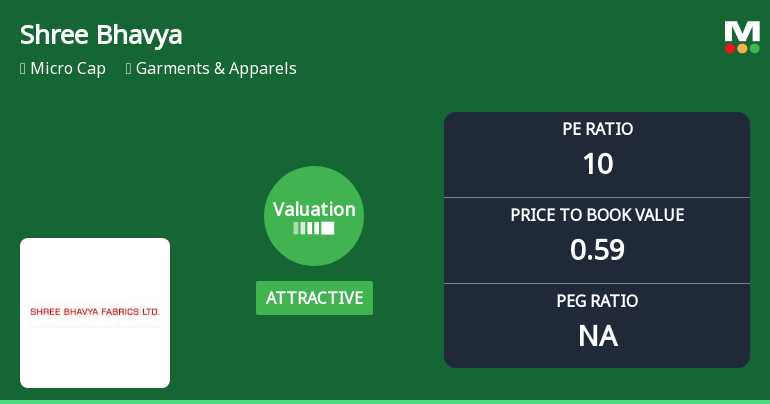
Shree Bhavya Fabrics Ltd: Valuation Shift Signals Renewed Price Attractiveness Amid Mixed Market Returns
2026-06-02 08:00:16Shree Bhavya Fabrics Ltd, a micro-cap player in the Garments & Apparels sector, has seen a notable shift in its valuation parameters, moving from very attractive to attractive territory. Despite a modest decline in share price and mixed returns relative to the Sensex, the company’s improved price-to-earnings and price-to-book ratios suggest a more compelling investment case compared to its peers.
Read full news article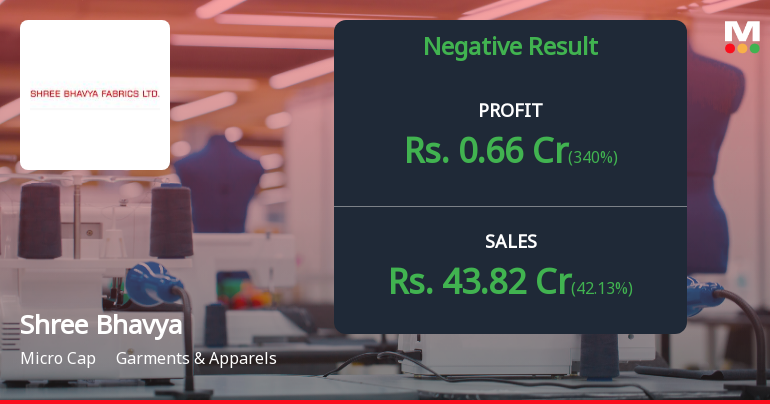
Shree Bhavya Fabrics Q4 FY26: Profit Surge Masks Deeper Margin Concerns
2026-05-30 23:15:43Shree Bhavya Fabrics Ltd., a micro-cap textile processor operating in the garments and apparels sector, reported a sharp sequential recovery in net profit for Q4 FY26, posting ₹0.66 crores compared to ₹0.15 crores in Q3 FY26—a sequential jump of 340%. However, the year-on-year comparison reveals a more sobering reality, with profits declining 26.67% from ₹0.90 crores in Q4 FY25. The stock, currently trading at ₹23.25 with a market capitalisation of ₹22.00 crores, has declined 0.39% following the results announcement, reflecting investor caution despite the quarterly improvement.
Read full news article


