
Key Events This Week
1 June: Intraday low amid price pressure; stock closes at Rs.3,709.15 (-3.38%)
1 June: Mixed Q4 2026 results reported with negative financial trend
5 June: Week closes at Rs.3,701.90 (-0.31% on day)
Jun 24, 03:30 PM
BSE+NSE Vol: 3.45 lacs
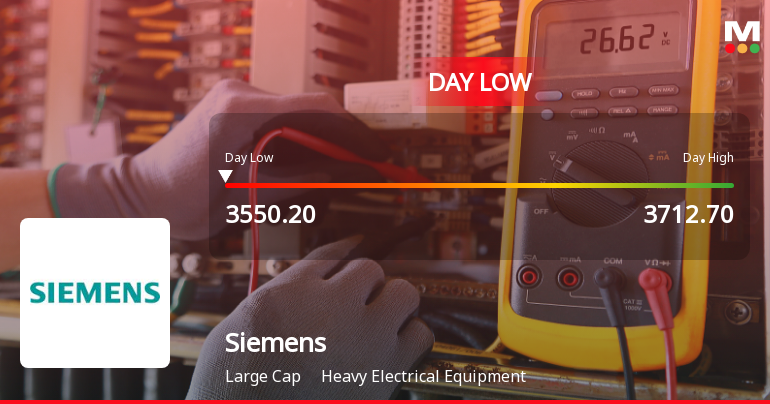
Siemens Ltd. experienced a notable intraday decline on 24 Jun 2026, touching a low of Rs 3,566.9 as the stock faced sustained price pressure. The share price fell by 3.42% during the day, underperforming its sector and broader market indices amid mixed technical signals and prevailing market dynamics.
Read full news article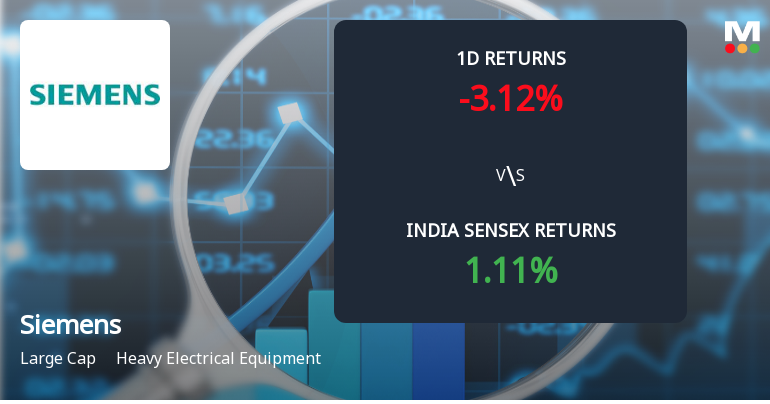
Siemens Ltd., a heavyweight in the Heavy Electrical Equipment sector, has witnessed a notable 11.4% surge in open interest in its derivatives segment, signalling heightened market activity and evolving investor positioning. Despite this, the stock has underperformed its sector and broader indices, reflecting a complex interplay of market sentiment and technical factors.
Read full news article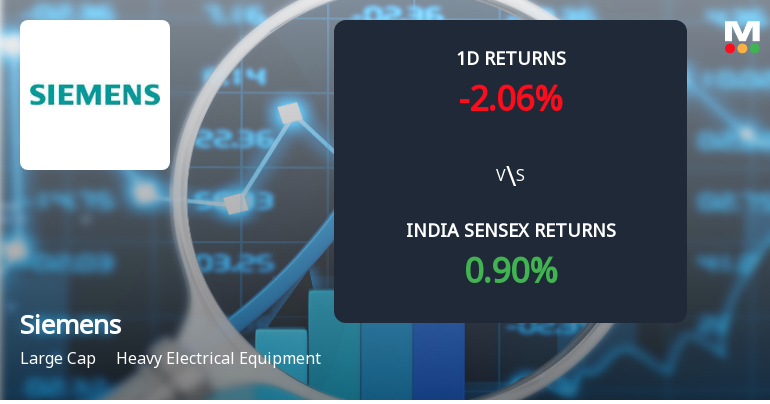
Siemens Ltd., a heavyweight in the Heavy Electrical Equipment sector, has witnessed a notable 10.27% increase in open interest in its derivatives segment, signalling heightened market activity and evolving investor positioning. Despite this surge, the stock has underperformed its sector and broader indices, reflecting a complex interplay of market forces and investor sentiment.
Read full news article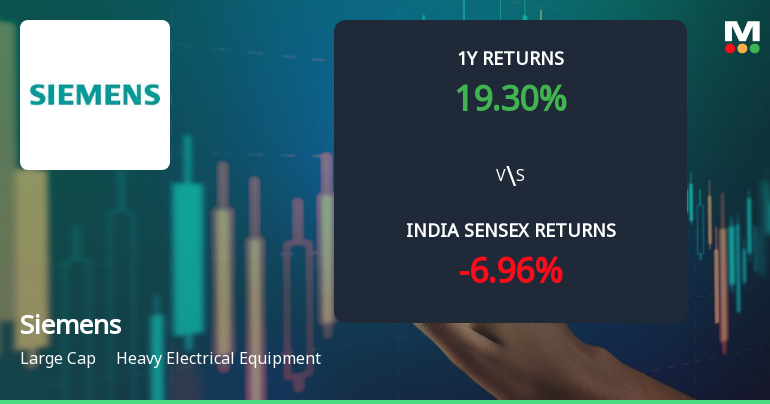
Siemens Ltd., a prominent player in the Heavy Electrical Equipment sector, has experienced a nuanced shift in its technical momentum, reflecting a complex interplay of bullish and bearish signals across key indicators. Despite a recent downgrade from Sell to Hold by MarketsMOJO on 8 April 2026, the stock’s price action and technical parameters suggest a cautiously optimistic outlook amid ongoing market volatility.
Read full news article
Siemens Ltd., a heavyweight in the Heavy Electrical Equipment sector, has witnessed a notable shift in its technical momentum, moving from a mildly bullish stance to a more confident bullish trend. This change is underscored by a blend of technical indicators, including MACD, RSI, moving averages, and Bollinger Bands, signalling a potential uptrend that investors should closely monitor amid the company’s strong market performance year-to-date.
Read full news article
1 June: Intraday low amid price pressure; stock closes at Rs.3,709.15 (-3.38%)
1 June: Mixed Q4 2026 results reported with negative financial trend
5 June: Week closes at Rs.3,701.90 (-0.31% on day)

Siemens Ltd. is rated 'Hold' by MarketsMOJO, with this rating last updated on 08 April 2026. However, the analysis and financial metrics presented here reflect the stock's current position as of 14 June 2026, providing investors with the most up-to-date view of the company’s performance and outlook.
Read full news article
8 June: Intraday low amid price pressure, stock falls 2.37%
9 June: Slight recovery with a 0.14% gain despite broader market rally
10 June: Renewed weakness, stock declines 1.04%
11 June: Technical momentum shifts to mildly bullish despite 1.60% drop
12 June: Stock rebounds 1.25%, outperforming Sensex’s 2.20% gain
Siemens Ltd., a heavyweight in the Heavy Electrical Equipment sector, has experienced a nuanced shift in its technical momentum, moving from a bullish to a mildly bullish stance. Despite a recent dip in price, key technical indicators such as MACD and KST maintain bullish signals on weekly and monthly charts, while moving averages and Bollinger Bands suggest cautious optimism. This article analyses the evolving technical landscape of Siemens Ltd., contextualising its price action against broader market trends and providing a comprehensive outlook for investors.
Read full news articlePlease refer the attached file
Please refer to the attached pdf
Please refer the attached file

No Upcoming Board Meetings

Siemens Ltd. has declared 600% dividend, ex-date: 30 Jan 25

Siemens Ltd. has announced 2:10 stock split, ex-date: 13 Jun 06

Siemens Ltd. has announced 1:1 bonus issue, ex-date: 29 Feb 08

No Rights history available


