
Key Events This Week
15 June: Technical momentum shifts amid mixed market signals
15 June: Valuation turns attractive with strong financial metrics
18 June: Sharp 5.00% intraday decline on heavy volume
19 June: Modest recovery with 1.42% gain despite Sensex dip

Signpost India Ltd Technical Momentum Shifts Amid Mixed Market Signals
2026-06-15 08:05:47Signpost India Ltd, a micro-cap player in the Media & Entertainment sector, has experienced a notable shift in its technical momentum, moving from a bullish to a mildly bullish stance. Despite a recent 6.44% decline in its share price to ₹260.80, the stock’s technical indicators present a nuanced picture, reflecting both positive and cautious signals amid broader market volatility.
Read full news article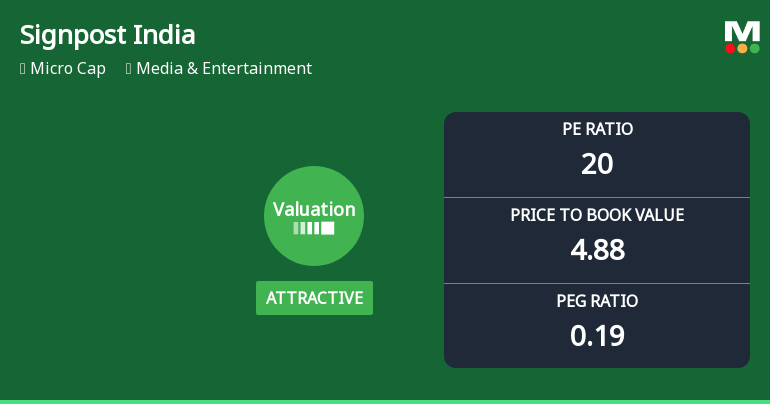
Signpost India Ltd Valuation Turns Attractive Amid Strong Financial Metrics
2026-06-15 08:02:24Signpost India Ltd, a micro-cap player in the Media & Entertainment sector, has seen its valuation parameters shift favourably, prompting an upgrade in its investment grade to Buy from Hold. With a current price of ₹260.80 and a market cap reflecting its micro-cap status, the company’s price-to-earnings (P/E) and price-to-book value (P/BV) ratios now present an attractive entry point compared to historical and peer averages.
Read full news articleSignpost India Ltd Declines 10.24%: Key Technical and Valuation Shifts Shape the Week
2026-06-13 15:10:00
Key Events This Week
1 June: Stellar Q4 FY26 results announced with a 2139% profit surge
2 June: Technical momentum shifts amid mixed market signals; sharp 7.4% price drop
3 June: Technical momentum upgrades to bullish with improved valuation signals
5 June: Week closes at ₹265.05, down 10.24% for the week
Signpost India Ltd Falls 1.60%: 5 Key Factors Driving the Week’s Volatility
2026-06-13 09:06:08
Key Events This Week
8 June: Stock opens at ₹265.05, declines 1.91% amid broader market weakness
9 June: Technical momentum shifts mildly bullish; valuation metrics improve; stock rebounds 3.42%
10 June: Record quarterly results announced; Mojo Grade upgraded to Buy; stock surges 5.09%
11 June: Technical momentum confirmed bullish; stock peaks at ₹278.75
12 June: Sharp decline of 6.44% closes week at ₹260.80 despite Sensex rally
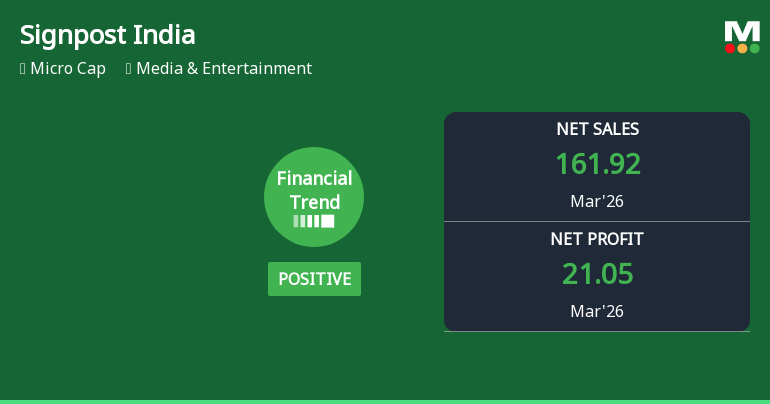
Signpost India Ltd Reports Record Quarterly Performance Amid Flat Financial Trend
2026-06-10 15:00:43Signpost India Ltd, a micro-cap player in the Media & Entertainment sector, has delivered its highest quarterly financial results to date in March 2026, marking a significant milestone despite a recent shift in its overall financial trend from positive to flat. The company’s latest quarter saw record revenues, profits, and earnings per share, signalling robust operational execution amid challenging market conditions.
Read full news article
Signpost India Ltd Upgraded to Buy on Strong Technicals and Attractive Valuation
2026-06-10 08:34:37Signpost India Ltd has seen its investment rating upgraded from Hold to Buy, reflecting significant improvements across valuation, technical indicators, financial trends, and overall quality metrics. The company’s robust quarterly performance, attractive valuation multiples, and bullish technical signals have collectively driven this positive reassessment by MarketsMOJO as of 09 June 2026.
Read full news article
Signpost India Ltd Technical Momentum Shifts Signal Bullish Outlook
2026-06-10 08:06:59Signpost India Ltd has exhibited a notable shift in its technical momentum, moving from a mildly bullish stance to a more confident bullish trend. This transition is underscored by key technical indicators such as the MACD, moving averages, and Bollinger Bands, signalling renewed investor interest and potential upside in the micro-cap media and entertainment stock.
Read full news article
Signpost India Ltd Technical Momentum Shifts Amid Mixed Market Returns
2026-06-09 08:05:43Signpost India Ltd, a micro-cap player in the Media & Entertainment sector, has experienced a nuanced shift in its technical momentum, moving from a bullish to a mildly bullish stance. Despite a recent day decline of 1.91%, the stock’s year-to-date return of 17.99% significantly outpaces the Sensex’s negative 13.72%, signalling underlying resilience amid broader market volatility.
Read full news articleAnnouncement under Regulation 30 (LODR)-Newspaper Publication
19-Jun-2026 | Source : BSENewspaper Advertisement of Second 100 Days Campaign -Saksham Niveshak.
Announcement under Regulation 30 (LODR)-Earnings Call Transcript
10-Jun-2026 | Source : BSEIntimation of Transcript of Earnings Conference Call held for the quarter and financial year ended March 31 2026
Announcement under Regulation 30 (LODR)-Analyst / Investor Meet - Outcome
03-Jun-2026 | Source : BSEPursuant to Regulation 30 read with Schedule III Part A Para A (15) of the SEBI Listing Regulations-Audio recording of Earnings Conference Call for the quarter and financial year ended March 31 2026
Corporate Actions

No Upcoming Board Meetings

Signpost India Ltd has declared 25% dividend, ex-date: 19 Sep 25

No Splits history available

No Bonus history available

No Rights history available


