

Key Events This Week
1 June: New 52-week high of Rs.424.5
1 June: Technical momentum upgrade to bullish
3 June: New 52-week high of Rs.425.25
4 June: Fresh 52-week high of Rs.425.7
5 June: Week closes at Rs.416.80 (-1.73% on day)
SIS Ltd Gains 0.94%: 2 Key Factors Driving the Week’s Momentum
2026-06-13 10:09:14
Key Events This Week
8 June: Stock opens at Rs.405.60, down 2.69% amid broad market weakness
9 June: Valuation shifts to fair with P/E rising to 13.4; stock rebounds to Rs.421.10 (+3.82%)
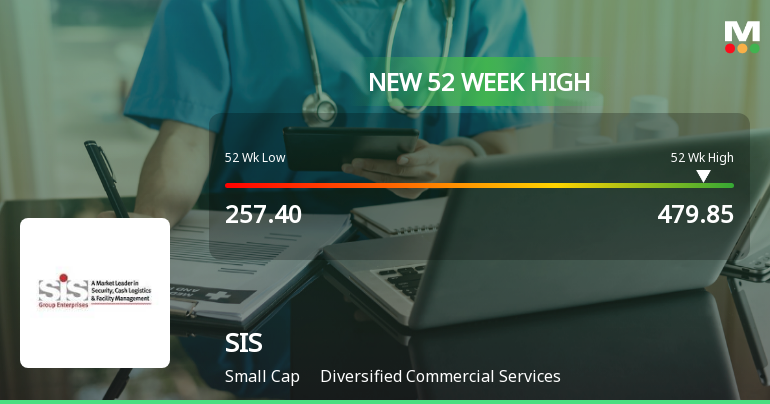
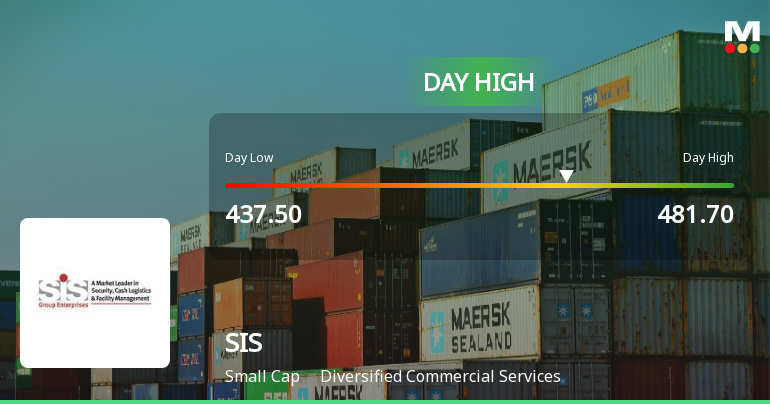
11 June: New 52-week high of Rs.443 reached, closing at Rs.428.20 (+2.77%)
12 June: Week closes at Rs.420.70, down 1.75% on the day but up for the week

Broad-Based Technical Strength Lifts SIS Ltd to 52-Week High of Rs 443
2026-06-11 10:10:57With a decisive surge to Rs 443 on 11 Jun 2026, SIS Ltd has reached a fresh 52-week high, marking a significant milestone in its price momentum. This advance comes amid a backdrop of strong technical signals and sustained outperformance relative to its sector and the broader market.
Read full news article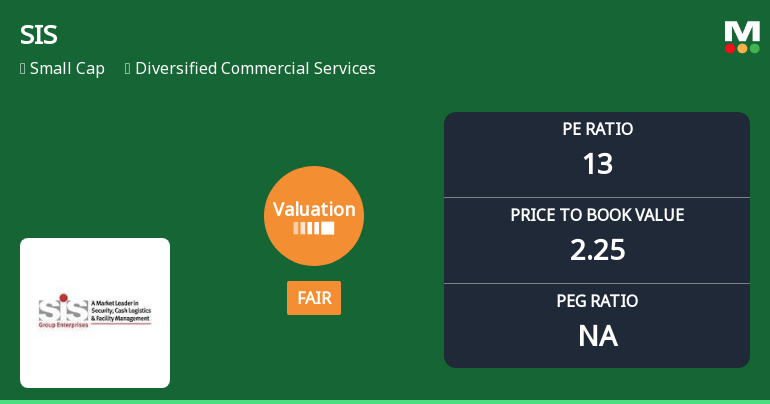
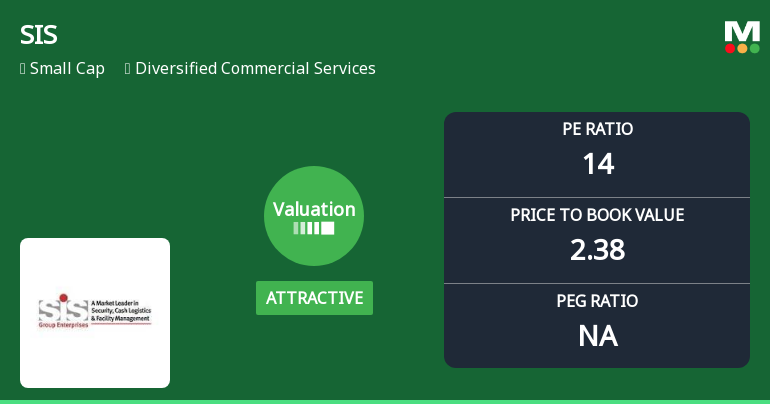
SIS Ltd Valuation Shifts to Fair Amidst Strong Market Performance
2026-06-09 08:01:21SIS Ltd, a key player in the diversified commercial services sector, has experienced a notable shift in its valuation parameters, moving from an attractive to a fair rating. This change reflects evolving market perceptions amid a backdrop of strong financial metrics and a mixed peer landscape, prompting investors to reassess the stock’s price attractiveness relative to its historical and sector benchmarks.
Read full news articleWhy is SIS Ltd falling/rising?
2026-06-09 02:37:03
Strong Quarterly Performance Drives Investor Confidence
SIS Ltd has demonstrated impressive financial growth in its latest quarterly results ending March 2026. The company reported a net sales increase of 30.96%, signalling strong operational momentum. Profit before tax (excluding other income) surged by 145.97% to ₹96.92 crores, while profit after tax grew by a similar magnitude of 145.9%, reaching ₹102.50 crores. These figures underscore the company’s ability to convert sales growth into substantial profitability gains.
Return on capital employed (ROCE) for the half-year period stands at a healthy 13.42%, reflecting efficient utilisation of capital. Furthermore, the company’s ROCE of 15.2, combined with an enterprise value to capital employed ratio of 2, suggests an ...
Read full news articleSecurity and Intelligence Services (India) Limited - Acquisition
09-Dec-2019 | Source : NSESecurity and Intelligence Services (India) Limited has informed the Exchange about Acquisition of shareholding in Adis Enterprises Private Limited by Dusters Total Solutions Services Private Limited, a wholly-owned subsidiary of Security and Intelligence Services (India) Limited ( the Company ).
Security and Intelligence Services (India) Limited - Updates
15-Nov-2019 | Source : NSESecurity and Intelligence Services (India) Limited has informed the Exchange regarding 'Dispatch of Postal Ballot - Newspaper Advertisement'.
Security and Intelligence Services (India) Limited - Other General Purpose
13-Nov-2019 | Source : NSESecurity and Intelligence Services (India) Limited has informed the Exchange regarding Disclosure of Related Party Transactions Under Regulation 23(9) of SEBI (Listing Obligations and Disclosure Requirements) Regulations 2015.
Corporate Actions

No Upcoming Board Meetings

SIS Ltd has declared 140% dividend, ex-date: 06 Feb 26

SIS Ltd has announced 5:10 stock split, ex-date: 15 Jan 20

No Bonus history available

No Rights history available


