
SJW Group Experiences Revision in Evaluation Amid Mixed Technical Indicators
2025-10-28 15:52:40SJW Group, a small-cap utility company, has seen its stock price rise slightly to $51.09 amid mixed technical indicators. Over the past year, it has experienced significant volatility, with a high of $58.91 and a low of $44.91, while underperforming the S&P 500 in returns.
Read full news articleIs SJW Group technically bullish or bearish?
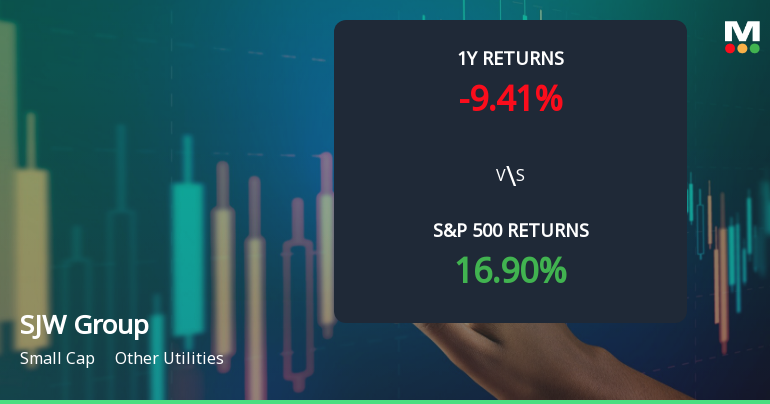
2025-10-28 11:39:05As of 24 October 2025, the technical trend for SJW Group has changed from sideways to mildly bearish. The current stance is bearish, with key indicators supporting this view including a daily moving average that is mildly bearish and a monthly MACD that is bearish. While the weekly MACD and KST are mildly bullish, the overall monthly indicators, including Bollinger Bands and Dow Theory, lean towards bearish. In terms of performance, SJW Group has underperformed the S&P 500 across multiple periods, with a 1-year return of -10.14% compared to the S&P 500's 16.90%, and a 5-year return of -21.17% versus 95.99% for the index....
Read full news articleIs SJW Group technically bullish or bearish?
2025-10-27 11:50:16As of 24 October 2025, the technical trend for SJW Group has changed from sideways to mildly bearish. The current stance is bearish, with key indicators supporting this view including a bearish monthly MACD and mildly bearish daily moving averages. While the weekly MACD and KST are mildly bullish, they are overshadowed by the overall bearish signals from the monthly indicators. The stock has underperformed relative to the S&P 500 over the past year, with a return of -10.14% compared to the S&P 500's 16.90%....
Read full news articleIs SJW Group technically bullish or bearish?
2025-10-26 11:25:01As of 24 October 2025, the technical trend for SJW Group has changed from sideways to mildly bearish. The current stance is mildly bearish, driven by the daily moving averages indicating a bearish trend, while the monthly MACD and Bollinger Bands also reflect bearish signals. The weekly MACD and KST are mildly bullish, suggesting some short-term strength, but overall, the longer-term indicators lean bearish. In terms of performance, SJW Group has underperformed the S&P 500 across multiple time frames, notably with a 1-year return of -10.14% compared to the S&P 500's 16.90%, and a 5-year return of -21.17% against the S&P 500's 95.99%....
Read full news article
Corporate Actions


