
Key Events This Week
25 May: Stock opens strong at Rs.11.54 (+4.62%) following technical upgrade
26 May: MarketsMOJO upgrades STL Global Ltd to Sell rating
27 May: Valuation rating shifts to Very Attractive amid mixed performance
29 May: Week closes at Rs.11.20 (+1.82%) despite Sensex decline
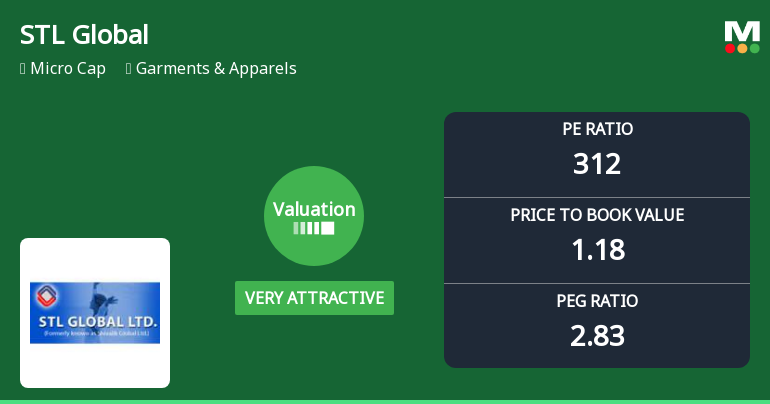
STL Global Ltd Valuation Shifts to Very Attractive Amidst Mixed Market Performance
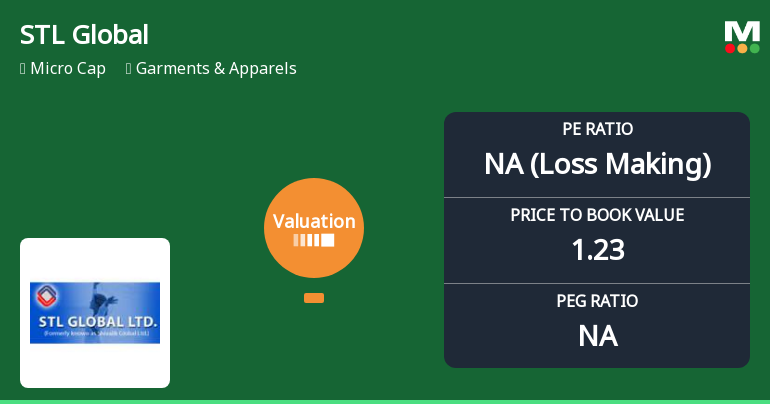
2026-05-27 08:00:33STL Global Ltd, a micro-cap player in the Garments & Apparels sector, has seen a notable shift in its valuation parameters, moving from an attractive to a very attractive rating despite ongoing challenges in operational returns and stock performance. This article analyses the recent changes in key valuation metrics such as price-to-earnings (P/E) and price-to-book value (P/BV) ratios, compares them with peer averages and historical benchmarks, and assesses the implications for investors.
Read full news article
STL Global Ltd Upgraded to Sell as Technicals Improve Amid Mixed Fundamentals
2026-05-26 08:43:17STL Global Ltd, a micro-cap player in the Garments & Apparels sector, has seen its investment rating upgraded from Strong Sell to Sell as of 25 May 2026. This change is primarily driven by a shift in technical indicators, even as the company continues to face challenges in its fundamental and financial metrics. The stock’s recent price movement and quarterly financial performance provide a nuanced picture for investors weighing its prospects.
Read full news articleSTL Global Ltd Falls 3.92%: Technical Weakness and Valuation Shifts Shape the Week
2026-05-23 17:14:47
Key Events This Week
18 May: Valuation grade upgraded to attractive amid elevated multiples
19 May: Downgrade to Strong Sell following weak technicals and financial trends
22 May: Week closes at Rs.11.03, down 3.92% versus Sensex +0.50%
When is the next results date for STL Global Ltd?
2026-05-22 23:19:41The next results date for STL Global Ltd is scheduled for 29 May 2026....
Read full news article
STL Global Ltd Downgraded to Strong Sell Amid Weak Technicals and Financial Trends
2026-05-19 08:37:26STL Global Ltd, a micro-cap player in the Garments & Apparels sector, has seen its investment rating downgraded from Sell to Strong Sell as of 18 May 2026. This shift reflects deteriorating technical indicators, a nuanced valuation outlook, and persistent financial challenges despite some recent operational improvements. The downgrade underscores growing investor caution amid the company’s underperformance relative to benchmarks and peers.
Read full news article
STL Global Ltd Valuation Shifts: Price Attractiveness Improves Amid Elevated Multiples
2026-05-18 08:00:57STL Global Ltd, a micro-cap player in the Garments & Apparels sector, has witnessed a notable shift in its valuation parameters, moving from a very attractive to an attractive rating. Despite a challenging market environment and a recent downgrade in its Mojo Grade to 'Sell', the company’s price-to-earnings and price-to-book ratios suggest evolving investor sentiment and valuation dynamics worth analysing in detail.
Read full news article
STL Global Ltd is Rated Sell
2026-05-13 10:10:52STL Global Ltd is rated 'Sell' by MarketsMOJO, with this rating last updated on 17 Mar 2026. While the rating was revised on that date, the analysis and financial metrics discussed here reflect the stock's current position as of 13 May 2026, providing investors with an up-to-date perspective on the company’s fundamentals, valuation, financial trends, and technical outlook.
Read full news article


