Key Events This Week
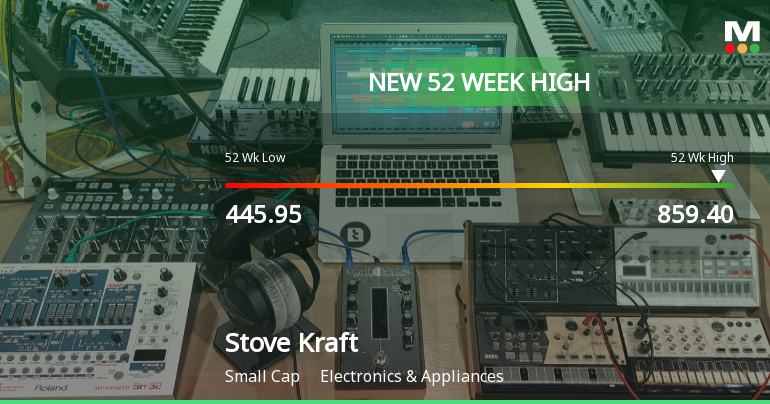
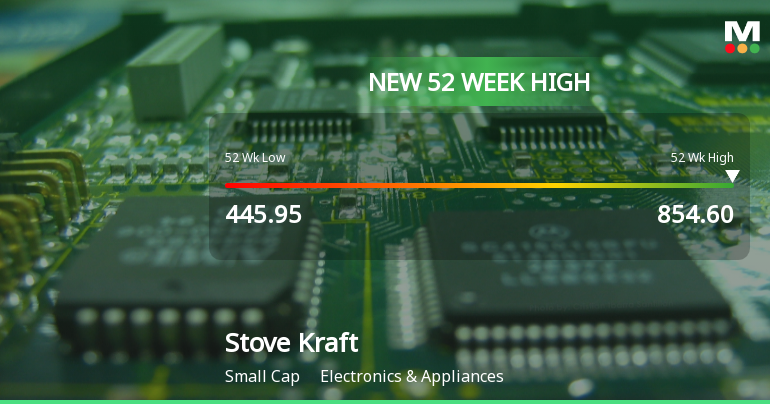
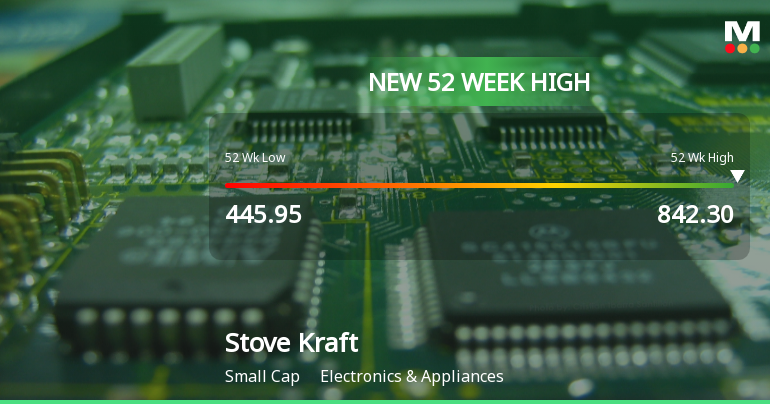
22 Jun: New 52-week high (Rs.730.90)
23 Jun: Golden Cross formation signalling potential bullish breakout
24 Jun: Bullish momentum shift amid mixed technical signals
25 Jun: Week closes at Rs.783.00 (+12.57%)

Stove Kraft Ltd is Rated Sell by MarketsMOJO
2026-06-25 10:10:05Stove Kraft Ltd is rated Sell by MarketsMOJO, with this rating last updated on 15 June 2026. While the rating change occurred on that date, the analysis and financial metrics presented here reflect the stock’s current position as of 25 June 2026, providing investors with the latest insights into the company’s performance and outlook.
Read full news article
Stove Kraft Ltd Sees Bullish Momentum Shift Amid Mixed Technical Signals
2026-06-24 08:05:19Stove Kraft Ltd has demonstrated a notable shift in price momentum, moving from a mildly bullish to a bullish technical trend, supported by a series of positive signals across key indicators such as MACD, Bollinger Bands, and moving averages. This technical evolution coincides with a strong price performance that outpaces the broader market, signalling renewed investor interest in this Electronics & Appliances small-cap stock.
Read full news article
Golden Cross Forms in Stove Kraft Ltd Amid Mixed Technical Signals and Strong Recent Rally
2026-06-23 18:00:50The 50-day moving average has crossed above the 200-day moving average for Stove Kraft Ltd, signalling a golden cross on 23 Jun 2026. Yet, the broader technical picture is nuanced, with weekly indicators mostly bullish but monthly momentum showing mild bearishness. This divergence raises questions about the reliability of the crossover as a standalone signal.
Read full news article
Stove Kraft Ltd Shows Mildly Bullish Momentum Amid Mixed Technical Signals
2026-06-18 08:05:17Stove Kraft Ltd, a small-cap player in the Electronics & Appliances sector, has exhibited a notable shift in its technical momentum, moving from a sideways trend to a mildly bullish stance. Despite a recent upgrade in its Mojo Grade from Strong Sell to Sell, the stock’s technical indicators present a complex picture, with bullish signals on weekly charts contrasting with mild bearishness on monthly timeframes. This article analyses the latest price momentum, key technical indicators, and relative performance against the Sensex to provide a comprehensive view for investors.
Read full news article