

Suratwwala Business Group Ltd Valuation Shifts Signal Changing Market Sentiment
2026-08-03 08:01:14Suratwwala Business Group Ltd, a micro-cap player in the realty sector, has witnessed a notable shift in its valuation parameters, moving from a fair to an expensive rating. This change reflects evolving market perceptions amid mixed financial signals and peer comparisons, prompting investors to reassess the stock’s price attractiveness in a challenging industry landscape.
Read full news article
Suratwwala Business Group Ltd is Rated Hold
2026-07-26 10:10:29Suratwwala Business Group Ltd is rated 'Hold' by MarketsMOJO, with this rating last updated on 29 May 2026. However, the analysis and financial metrics discussed here reflect the company’s current position as of 26 July 2026, providing investors with the latest insights into its performance and outlook.
Read full news article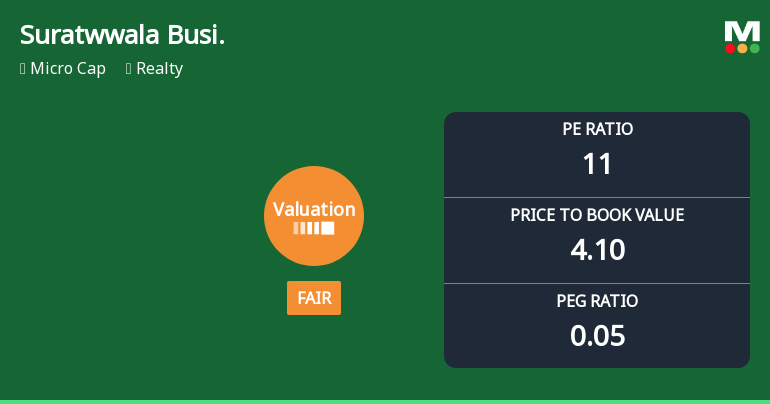
Suratwwala Business Group Ltd Valuation Shifts to Fair Amidst Mixed Market Returns
2026-07-24 08:01:33Suratwwala Business Group Ltd, a micro-cap player in the realty sector, has witnessed a notable shift in its valuation parameters, moving from an expensive to a fair valuation grade. This change, coupled with its improving financial metrics and relative price attractiveness compared to peers, marks a significant development for investors analysing the stock’s potential in a challenging market environment.
Read full news article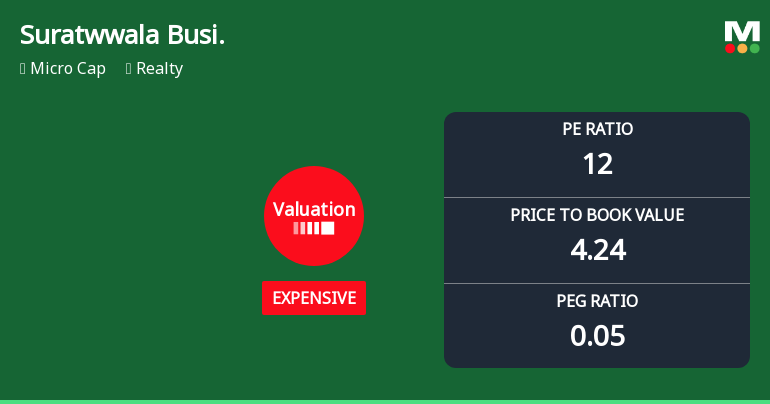
Suratwwala Business Group Ltd Valuation Shifts Signal Changing Market Sentiment
2026-07-16 08:01:18Suratwwala Business Group Ltd, a micro-cap player in the Realty sector, has experienced a notable shift in its valuation parameters, moving from a fair to an expensive rating. This change reflects evolving market perceptions and has implications for investors assessing the stock’s price attractiveness relative to its historical averages and peer group.
Read full news article
Suratwwala Business Group Ltd is Rated Hold
2026-07-15 10:10:06Suratwwala Business Group Ltd is rated 'Hold' by MarketsMOJO, with this rating last updated on 29 May 2026. While the rating change occurred on that date, the analysis and financial metrics discussed here reflect the company’s current position as of 15 July 2026, providing investors with the latest insights into the stock’s fundamentals, valuation, financial trends, and technical outlook.
Read full news article
Suratwwala Business Group Ltd Valuation Shifts to Fair; P/E and P/BV Ratios Signal Improved Price Attractiveness
2026-07-10 08:00:46Suratwwala Business Group Ltd has witnessed a notable shift in its valuation parameters, moving from an expensive to a fair valuation grade. This change, coupled with robust return on capital employed and equity metrics, suggests a recalibration of price attractiveness for investors within the realty sector. Despite recent underperformance relative to the Sensex, the company’s improved price-to-earnings and price-to-book ratios position it as a micro-cap contender worthy of closer scrutiny.
Read full news article
Suratwwala Business Group Ltd is Rated Hold
2026-07-04 10:10:33Suratwwala Business Group Ltd is rated 'Hold' by MarketsMOJO, with this rating last updated on 29 May 2026. While the rating change occurred on that date, the analysis and financial metrics discussed here reflect the company’s current position as of 04 July 2026, providing investors with the latest insights into the stock’s fundamentals, valuation, financial trends, and technical outlook.
Read full news article
Suratwwala Business Group Ltd Valuation Shifts to Fair Amid Market Volatility
2026-07-02 08:05:21Suratwwala Business Group Ltd, a micro-cap player in the Realty sector, has seen a notable shift in its valuation parameters, moving from an expensive to a fair valuation grade. This change is underpinned by a significant recalibration of its price-to-earnings (P/E) and price-to-book value (P/BV) ratios, positioning the stock as more price-attractive relative to its historical levels and peer group. Despite recent price declines, the company’s robust return on capital employed (ROCE) and return on equity (ROE) metrics continue to support its fundamental strength.
Read full news article
Suratwwala Business Group Ltd is Rated Hold by MarketsMOJO
2026-06-23 10:10:04Suratwwala Business Group Ltd is rated 'Hold' by MarketsMOJO, with this rating last updated on 29 May 2026. While the rating was revised on that date, the analysis and financial metrics discussed here reflect the stock's current position as of 23 June 2026, providing investors with an up-to-date perspective on the company’s performance and outlook.
Read full news article
Corporate Actions

No Upcoming Board Meetings

Suratwwala Business Group Ltd has declared 10% dividend, ex-date: 12 Sep 25

Suratwwala Business Group Ltd has announced 1:10 stock split, ex-date: 18 Apr 24

No Bonus history available

No Rights history available


