
Key Events This Week
15 Jun: Stock opens at ₹8.55, no price change
16 Jun: Price declines 1.17% to ₹8.45 amid rising volume
17 Jun: Downgrade to Strong Sell announced; stock falls 4.62% to ₹8.06
18 Jun: Valuation grade upgraded to Attractive; stock marginally recovers to ₹8.10 (+0.50%)
19 Jun: Stock closes week at ₹7.90, down 2.47% on heavy volume

Svaraj Trading & Agencies Ltd Downgraded to Strong Sell Amid Technical Weakness and Flat Financials
2026-06-18 08:07:27Svaraj Trading & Agencies Ltd, a micro-cap player in the Non Banking Financial Company (NBFC) sector, has seen its investment rating downgraded from Sell to Strong Sell as of 17 June 2026. This shift reflects deteriorating technical indicators, flat financial performance, and a mixed valuation profile, signalling caution for investors amid challenging market conditions.
Read full news article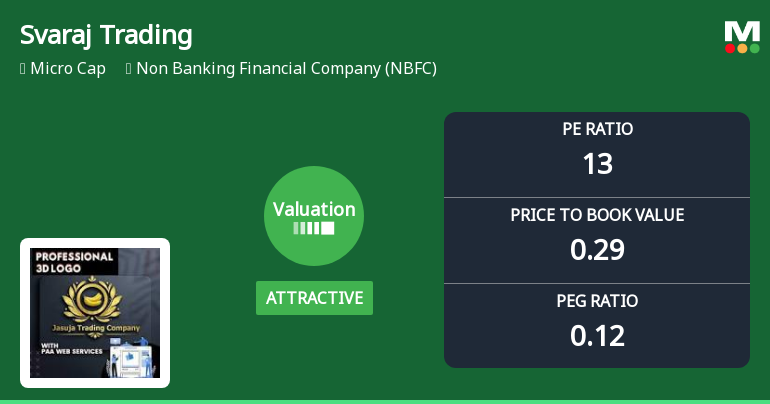
Svaraj Trading & Agencies Ltd: Valuation Shifts Signal Renewed Price Attractiveness
2026-06-18 08:00:48Svaraj Trading & Agencies Ltd, a micro-cap player in the Non Banking Financial Company (NBFC) sector, has seen a notable shift in its valuation parameters, moving from fair to attractive territory. Despite a recent share price decline of 4.62% on 18 Jun 2026, the company’s price-to-earnings (P/E) and price-to-book value (P/BV) ratios now present a compelling case for investors seeking value in a challenging market environment.
Read full news articleSvaraj Trading Gains 0.73%: Valuation Appeal Amid Fundamental Challenges
2026-06-13 17:20:14
Key Events This Week
1 June: Quality grade downgraded to Below Average, highlighting fundamental challenges
1 June: Investment rating revised to Sell amid mixed financial and valuation signals
1 June: Valuation metrics shift to attractive, signalling renewed price appeal
5 June: Week closes at Rs.8.31, up 0.73% versus Sensex decline of 0.78%
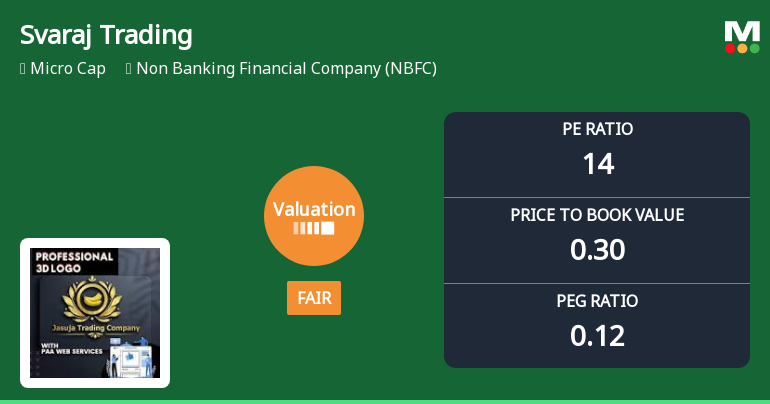
Svaraj Trading & Agencies Ltd: Valuation Shifts Signal Changing Price Attractiveness
2026-06-10 08:01:00Svaraj Trading & Agencies Ltd, a micro-cap player in the Non Banking Financial Company (NBFC) sector, has experienced a notable shift in its valuation parameters, moving from an attractive to a fair valuation grade. This change reflects evolving market perceptions amid subdued profitability metrics and a challenging sector backdrop, prompting a reassessment of its price attractiveness relative to peers and historical benchmarks.
Read full news article
Svaraj Trading & Agencies Ltd Downgraded to Sell Amid Mixed Financial and Valuation Signals
2026-06-01 08:06:08Svaraj Trading & Agencies Ltd, a micro-cap player in the Non Banking Financial Company (NBFC) sector, has seen its investment rating updated to a Sell with a Mojo Score of 44.0 as of 29 May 2026. This revision reflects a nuanced assessment across four key parameters: quality, valuation, financial trend, and technicals, highlighting both challenges and opportunities for investors navigating this stock.
Read full news article
Svaraj Trading & Agencies Ltd Valuation Shifts Signal Renewed Price Attractiveness
2026-06-01 08:03:56Svaraj Trading & Agencies Ltd, a micro-cap player in the Non Banking Financial Company (NBFC) sector, has seen a notable shift in its valuation parameters, moving from a risky to an attractive valuation grade. This change comes amid a backdrop of mixed returns relative to the Sensex and evolving market sentiment, prompting investors to reassess the stock’s price attractiveness and growth prospects.
Read full news article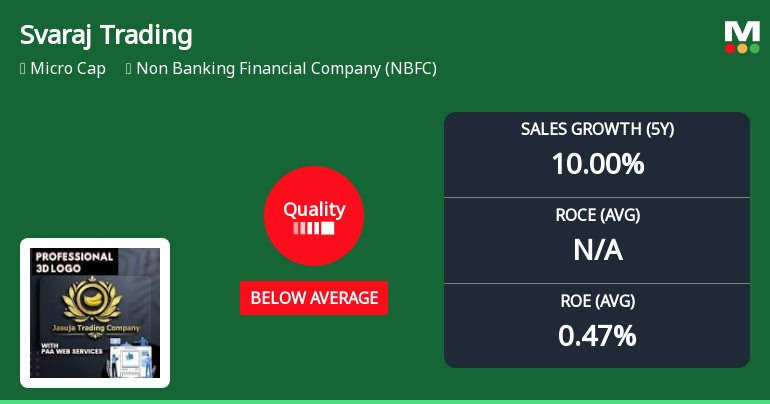
Svaraj Trading & Agencies Ltd Quality Grade Downgrade Highlights Fundamental Challenges
2026-06-01 08:00:51Svaraj Trading & Agencies Ltd, a micro-cap player in the Non Banking Financial Company (NBFC) sector, has recently seen its quality grade downgraded from "Does Not Qualify" to "Below Average" as of 29 May 2026. This shift reflects a deterioration in key business fundamentals, including profitability metrics, growth consistency, and capital structure, raising concerns about the company’s operational health and investor appeal.
Read full news articleCompliances-Certificate under Reg. 74 (5) of SEBI (DP) Regulations 2018
10-Jul-2026 | Source : BSECertificate under Regulation 74(5) of SEBI (DP) Regulations 2018 for the quarter ended June 30 2026
Announcement under Regulation 30 (LODR)-Newspaper Publication
09-Jul-2026 | Source : BSEPlease find enclosed copy of Newspaper publication regarding special window for re-lodgement of transfer and dematerialisation request(s) of Physical securities
Closure of Trading Window
26-Jun-2026 | Source : BSEIntimation of Closure of Trading Window
Corporate Actions

No Upcoming Board Meetings

No Dividend history available

No Splits history available

No Bonus history available

No Rights history available


