
Kroger Co. Experiences Revision in Stock Evaluation Amid Mixed Market Signals
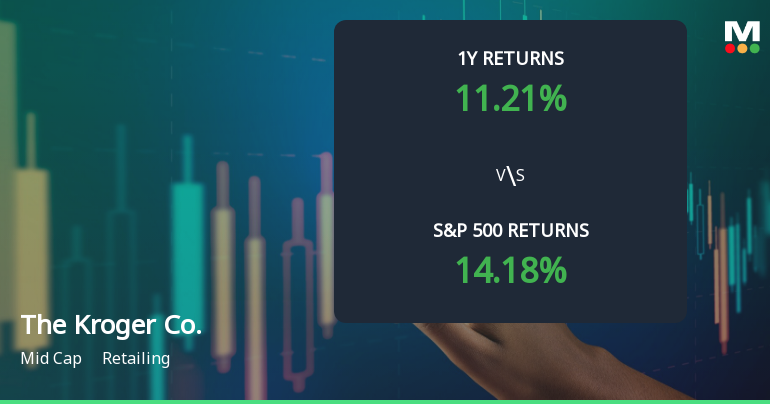
2025-12-01 16:04:30Kroger Co. has recently revised its evaluation amid changing market conditions. The stock is priced at $67.28, with a one-year return of 11.21%, trailing the S&P 500's 14.18%. Despite mixed technical indicators, Kroger has shown strong five-year performance, outperforming the S&P 500 significantly.
Read full news articleIs The Kroger Co. technically bullish or bearish?
2025-11-05 11:19:14As of 31 October 2025, the technical trend for The Kroger Co. has changed from mildly bearish to bearish. The weekly MACD is bearish, and the daily moving averages also indicate a bearish stance. The Bollinger Bands show a bearish signal on the weekly timeframe, while the monthly view is mildly bullish. The KST and Dow Theory are both bearish on the weekly and mildly bearish on the monthly. In terms of performance, Kroger's returns have lagged behind the S&P 500 across multiple periods, with a year-to-date return of 4.27% compared to the S&P 500's 16.30%, and a one-year return of 12.71% versus 19.89%. Overall, the technical stance is bearish with moderate strength....
Read full news article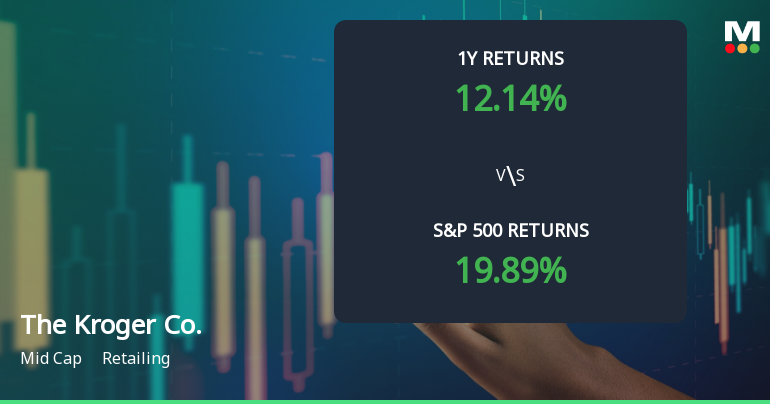
Kroger Co. Experiences Revision in Stock Evaluation Amid Market Dynamics
2025-11-04 15:46:12Kroger Co. has recently revised its evaluation amid fluctuating market conditions, with its stock priced at $63.44. The company has experienced notable volatility over the past year. Technical indicators suggest a bearish trend, and Kroger's performance lags behind the S&P 500 in both short- and long-term comparisons.
Read full news articleIs The Kroger Co. technically bullish or bearish?
2025-11-04 11:30:42As of 31 October 2025, the technical trend for The Kroger Co. has changed from mildly bearish to bearish. The weekly MACD is bearish, and the daily moving averages also indicate a bearish stance. The Bollinger Bands show a bearish signal on the weekly timeframe, while the monthly view is mildly bullish. The KST and Dow Theory both reflect a bearish sentiment on the weekly and monthly charts. In terms of performance, Kroger has underperformed the S&P 500 across multiple periods, with a year-to-date return of 3.74% compared to the S&P 500's 16.30%, and a one-year return of 12.14% versus 19.89%. Overall, the current technical stance is bearish, indicating weakness in the stock's performance....
Read full news articleIs The Kroger Co. technically bullish or bearish?
2025-11-03 11:29:53As of 31 October 2025, the technical trend for The Kroger Co. has changed from mildly bearish to bearish. The current technical stance is bearish, with key indicators supporting this view including a bearish MACD on the weekly timeframe, bearish moving averages, and a bearish KST on the weekly chart. The Bollinger Bands indicate a mildly bullish stance on the monthly timeframe, but this is overshadowed by the overall bearish signals. In terms of performance, Kroger has underperformed against the S&P 500 over the past week and month, with returns of -5.19% and -4.33% respectively, while the S&P 500 gained 0.71% and 1.92%. Year-to-date, Kroger's return of 4.06% is significantly lower than the S&P 500's 16.30%....
Read full news articleIs The Kroger Co. technically bullish or bearish?
2025-11-02 11:15:54As of 31 October 2025, the technical trend for The Kroger Co. has changed from mildly bearish to bearish. The current technical stance is bearish, with key indicators supporting this view including a bearish MACD on the weekly timeframe, bearish moving averages, and a bearish KST on the weekly. The Bollinger Bands indicate a mildly bullish stance on the monthly, but overall, the weekly indicators dominate the analysis. In terms of performance, Kroger has underperformed the S&P 500 over the past week and month, with returns of -5.19% and -4.33% respectively, compared to the S&P 500's gains of 0.71% and 1.92%. Over the longer term, Kroger's returns have been more favorable, but the recent trend suggests caution....
Read full news article
Corporate Actions


