


Key Events This Week
1 June: Q4 FY26 results reveal flat financial performance amid margin pressures; stock plunges 12.00%
2 June: Partial recovery with 3.82% gain following stabilisation signals
3 June: Sharp decline of 5.78% as revenue concerns persist
4 June: Minor dip of 0.43% amid cautious trading
5 June: Week closes near lows with a 0.12% fall, volume dries up
Are Tirupati Starch & Chemicals Ltd latest results good or bad?
2026-06-02 19:28:30Tirupati Starch & Chemicals Ltd's latest financial results for Q4 FY26 present a mixed picture of operational performance. The company reported a net profit of ₹2.44 crores, reflecting a year-on-year increase of 58.44%, although it showed a slight decline of 0.81% compared to the previous quarter. This indicates a recovery in profitability metrics, which may suggest improved cost management. However, the company faced challenges with its net sales, which totaled ₹89.86 crores, marking a year-on-year decline of 7.84% and a sequential decrease of 2.26%. This trend of declining sales has persisted for three consecutive quarters, raising concerns about the sustainability of the company's revenue growth and overall demand in its market segment. The operating margin improved significantly to 8.69%, the highest in recent quarters, which is a positive development. This improvement in margins is attributed to effe...
Read full news article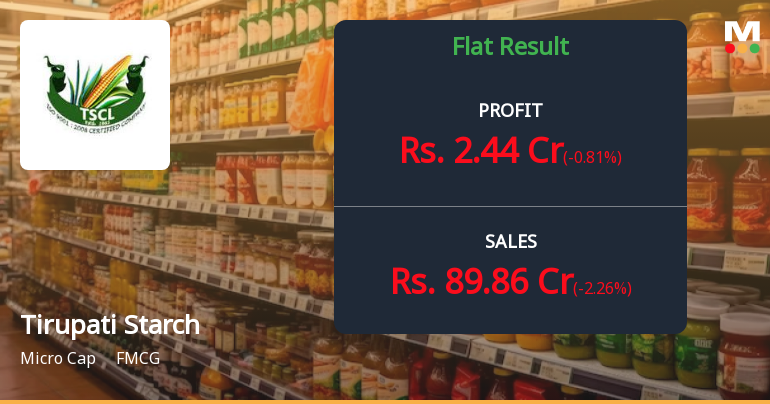
Tirupati Starch Q4 FY26: Marginal Profit Growth Masks Persistent Revenue Decline
2026-06-01 18:27:01Tirupati Starch & Chemicals Ltd., a micro-cap manufacturer of maize starch derivatives, reported a net profit of ₹2.44 crores for Q4 FY26, representing a marginal decline of 0.81% quarter-on-quarter but a significant improvement of 58.44% year-on-year. However, this profit recovery comes against a backdrop of persistent revenue weakness, with net sales declining 7.84% year-on-year to ₹89.86 crores. The stock reacted sharply to the results, plunging 12.00% to ₹130.90 in the trading session following the announcement, reflecting investor concerns about the company's ability to sustain growth momentum amidst challenging operating conditions.
Read full news article


