

Key Events This Week
6 Apr: Valuation shifts signal renewed price attractiveness
7 Apr: Downgrade to Sell amid mixed financial and technical signals
9 Apr: Upgrade back to Hold on technical and financial improvements
10 Apr: Week closes at Rs.79.42 (-18.54%) vs Sensex +5.34%

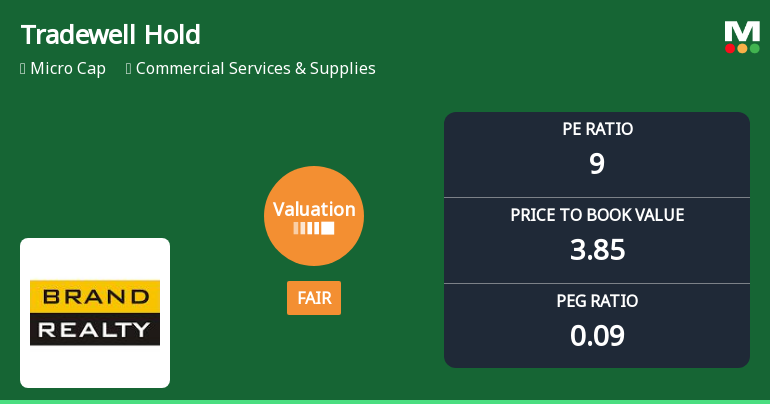
Tradewell Holdings Ltd Upgraded to Hold by MarketsMOJO on Technical and Financial Improvements
2026-04-10 08:02:25Tradewell Holdings Ltd, a micro-cap player in the Commercial Services & Supplies sector, has seen its investment rating upgraded from Sell to Hold as of 9 April 2026. This change reflects a combination of improved technical indicators, positive financial trends, and a reassessment of valuation metrics, signalling a cautious but optimistic outlook for investors.
Read full news article
Tradewell Holdings Ltd Downgraded to Sell Amid Mixed Financial and Technical Signals
2026-04-08 08:04:00Tradewell Holdings Ltd, a micro-cap player in the Commercial Services & Supplies sector, has seen its investment rating downgraded from Hold to Sell as of 7 April 2026. This adjustment reflects a nuanced reassessment across four key parameters: quality, valuation, financial trend, and technicals. Despite strong long-term returns and recent profit growth, concerns over operating losses, valuation metrics, and mixed technical signals have prompted a more cautious stance.
Read full news article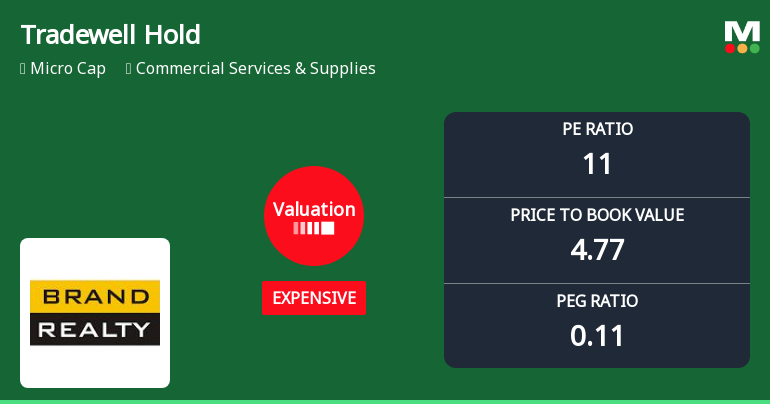
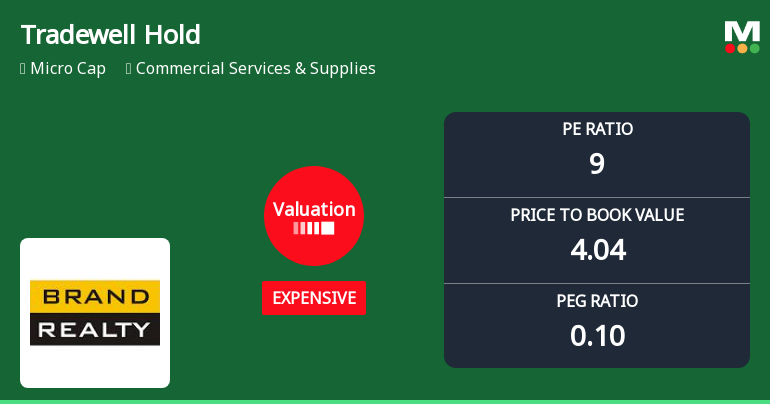
Tradewell Holdings Ltd Valuation Shifts Signal Renewed Price Attractiveness
2026-04-06 08:00:20Tradewell Holdings Ltd has witnessed a notable shift in its valuation parameters, moving from a very expensive to an expensive rating, reflecting a subtle improvement in price attractiveness. Despite a recent 5.00% decline in its share price to ₹92.96, the micro-cap company’s price-to-earnings (P/E) and price-to-book value (P/BV) ratios suggest a more balanced valuation compared to its historical extremes and peer group, warranting a closer examination of its financial metrics and market performance.
Read full news article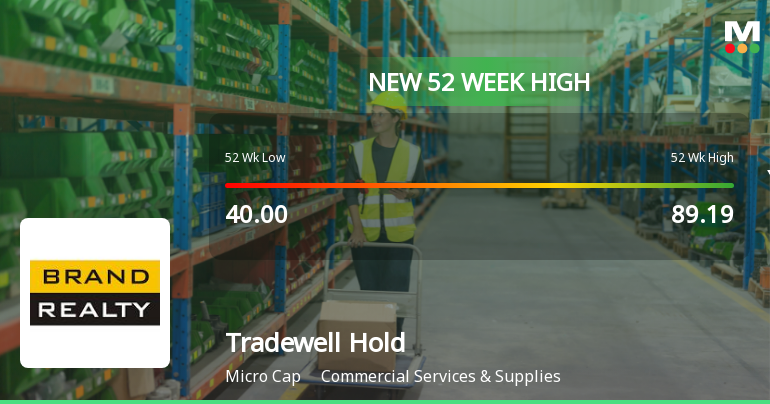
Broad-Based Technical Strength Lifts Tradewell Holdings Ltd to 52-Week High of Rs 102.74
2026-04-02 11:10:54With a decisive surge to Rs 102.74 on 2 Apr 2026, Tradewell Holdings Ltd has reached a fresh 52-week high, marking a remarkable rally from its low of Rs 40 in the past year. This milestone is underscored by a strong alignment of technical indicators and sustained price momentum, even as the broader market struggles.
Read full news article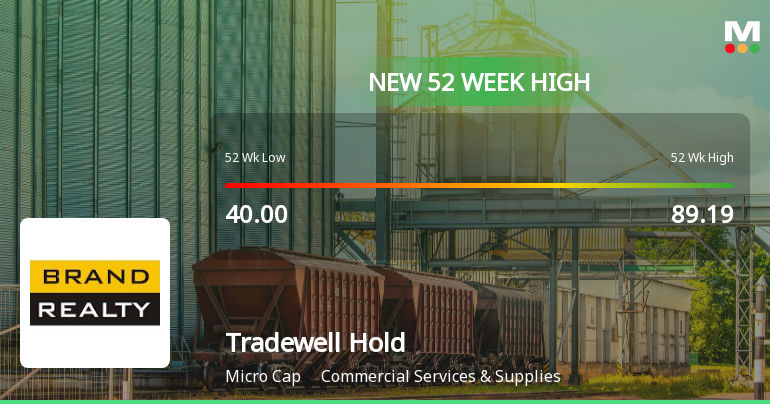
Broad-Based Technical Strength Lifts Tradewell Holdings Ltd to 52-Week High of Rs 98.06
2026-04-01 10:35:29With a decisive intraday surge to Rs 98.06 on 1 Apr 2026, Tradewell Holdings Ltd has marked a significant milestone by reaching a fresh 52-week high. This achievement caps a strong three-day rally that has delivered a 15.38% return, underscoring robust price momentum despite a challenging broader market backdrop.
Read full news article


